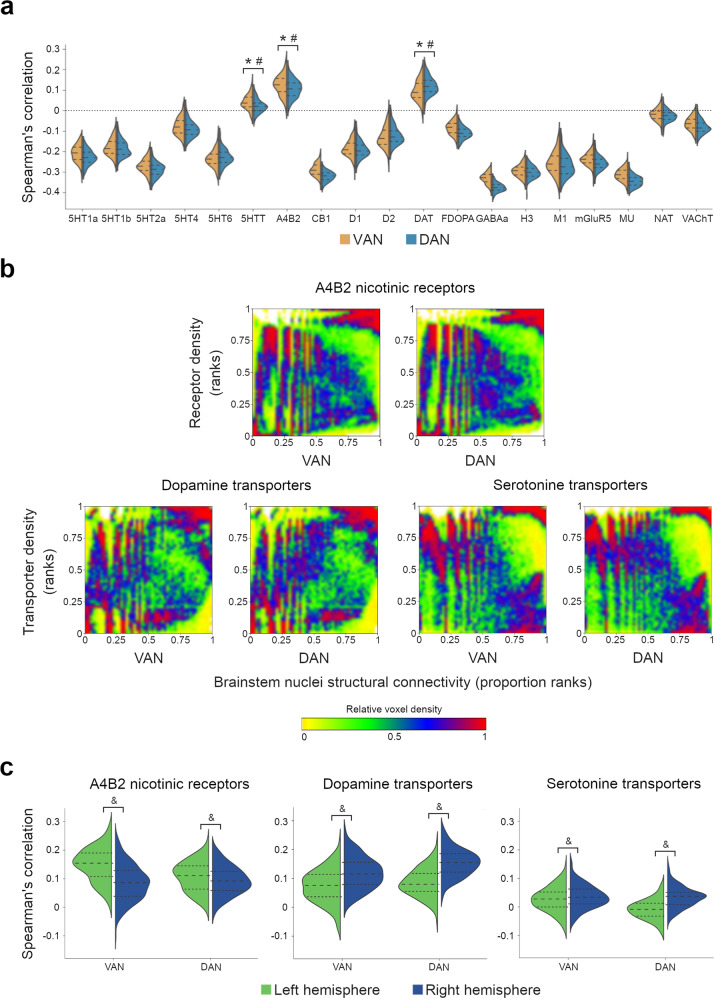
Fig. 6. Correlation between the structural projections of the brainstem nuclei and the neurotransmitter systems.
a Distributions of the Spearman’s correlations for the available maps of neurotransmitter receptors and transporters; for the receptors or transporters with two or more maps available, the mean correlation was calculated. Dashed lines represent the median and the interquartile range; the minimum and maximum correspond to the violin limits. b Graphical representation of the statistically significant positive correlations, i.e., the acetylcholine α4β2 nicotinic receptor, dopamine, and serotonin transporter maps. The color map represents the relative voxel density at each graph point. c Spearman’s correlation of the statistically significant positive correlations with the left and right hemispheres. Dashed lines represent the median and the interquartile range; the minimum and maximum correspond to the violin limits. 5HT1a serotonin 1a receptors, 5HT1b serotonin 1b receptors, 5HT2a serotonin 2a receptors, 5HTT serotonin transporters, A4B2 acetylcholine α4β2 nicotinic receptors, CB1 cannabinoid receptors 1, D1 dopamine receptors 1, D2 dopamine receptors 2, DAT dopamine transporters, FDOPA fluorodopa, GABAa GABAa receptors, H3 histamine receptors 3, M1 muscarinic receptors 1, mGluR5 metabotropic glutamate receptors 5, MU mu-opioid receptors, NAT noradrenaline transporters, VAchT vesicular acetylcholine transporters. * Statistically significant positive correlation, corrected for multiple comparisons (p < 0.003); # Statistically significant difference between the VAN and the DAN, corrected for multiple comparisons (p < 0.017); & Statistically significant difference between right and left hemispheres, corrected for multiple comparisons (p < 0.017); n = 177.

