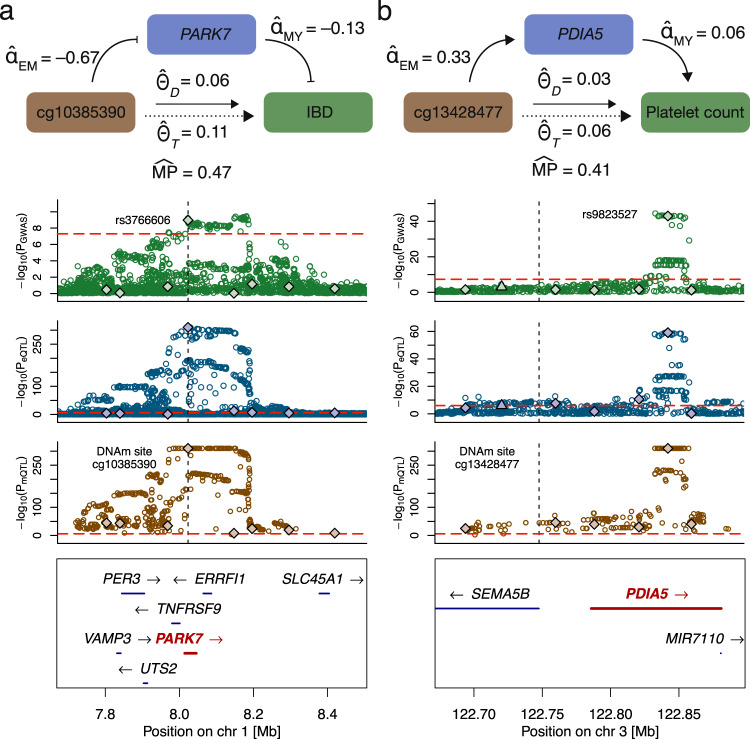
Fig. 5. Plausible DNAm-transcript-trait regulatory mechanisms.
a Mechanism involving DNAm probe cg10385390, PARK7 and inflammatory bowel disease (IBD). b Mechanism involving DNAm probe cg13428477, PDIA5 and platelet count. The top row displays a schematic of the mechanism with estimated univariable (total effect , DNAm-to-transcript effect and transcript-to-outcome effect ) and multivariable (direct effect ) MR effects (displayed mediation proportions (s) are derived from and estimates). The three following rows show the regional SNP associations (-log10(p-values)) with the trait (GWAS, green), transcript (eQTL, blue) and DNAm (mQTL, brown) probe, respectively. Solid diamonds represent DNAm-associated instruments used in the univariable (for calculation) and multivariable (for calculation) MR analyses. Upwards pointing triangles are transcript-associated SNPs that were additionally included in the MVMR instrument set. Red dashed lines indicate the significance thresholds of the respective SNP associations and the vertical black dashed line represents the DNAm probe position. Bottom row illustrates the positions and strand direction of the genes in the locus.

