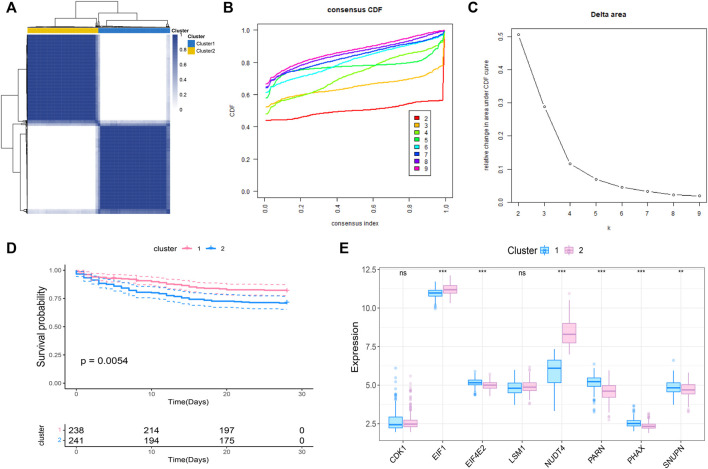
FIGURE 2.
Molecular classification of sepsis based on m7G-related prognosis genes. (A) Consensus clustering heatmap: when k = 2, the clustering of samples is relatively stable. (B) The cumulative distribution function (CDF) curve. (C) The delta area score displays the survival curves of these two subtypes (k = 2) with the relative increase of cluster stability (D). Kaplan-Meier curve showed the statistical difference between these two subtypes (p < 0.0001), and the prognosis of patients within Cluster 2 was poor. (E) Expression profile of m7G gene in the two subtypes.

