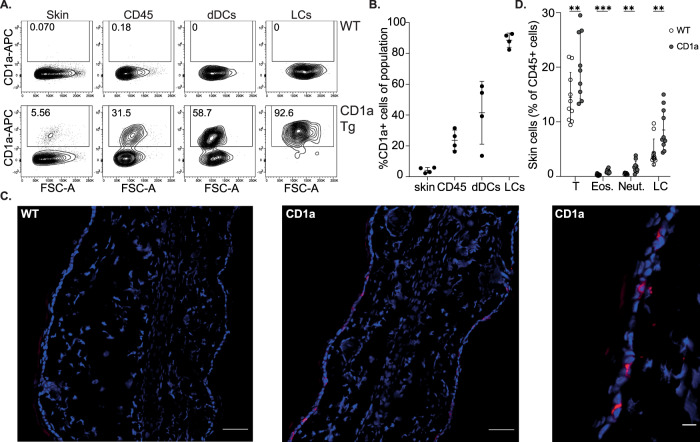
Fig. 1. Characterization of CD1a transgenic mouse.
A Representative flow cytometry plots and B graphical summary of CD1a protein expression by wild-type (WT) and CD1a transgenic (CD1a Tg) C57BL/6 J mice. CD1a protein expression evaluated on (left-right) total live ear skin cells, CD45 + skin cells, dermal dendritic cells (dDCs, CD45+/CD11c+/langerin-) and Langerhans cells (LCs, CD45+/CD11c+/langerin+). n = 4 for all groups examined over 2 independent experiments. Mean ± SD is shown. n represents biologically independent animals in each group. C CD1a protein expression within ear skin of wild-type (WT) and CD1a transgenic (CD1a) mice, visualized by immunofluorescence. Cryosections were stained with DAPI (blue) and anti-CD1a AF-594 (OKT6, red), scale bars left to right 50, 50 and 10 µm. Data shown are representative of 3 independent experiments. D Frequency of T cells (T), Eosinophils (Eos.), Neutrophils (Neut.) and Langerhans cells (LC) in the skin of wild-type (WT) and CD1a transgenic (CD1a) mice as measured by flow cytometry as a percentage of CD45 + cells. n = 11 examined over 3 independent experiments. Grouped analysis multiple unpaired two-tailed t-tests with Holm-Sidak correction, mean ± SD, **P < 0.01; ***P < 0.001. Mean ± SD is shown. n represents biologically independent animals in each group. Exact p-values are recorded in Supplementary Table 1. Source Data are provided as a Source Data file.

