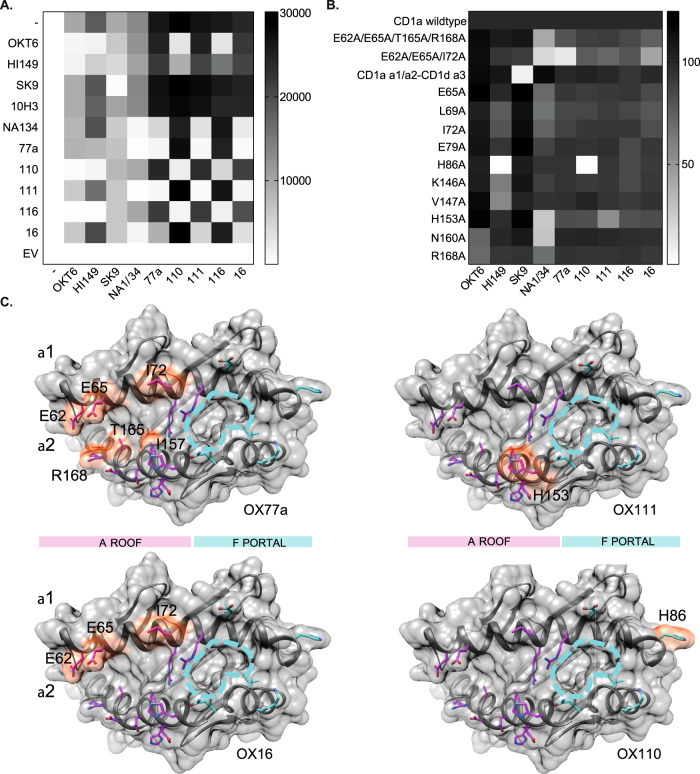
Fig. 3. CD1a epitope analysis.
A Matrix heatmap representation of CD1a antibody binding by flow cytometry as measured by CD1a-AF647 mean fluorescence intensity (MFI). Before staining of CD1a-K652 with anti-CD1a antibodies conjugated to fluorophore AF647 (horizontal axis), the relevant purified antibodies (vertical axis) were incubated with the cells to assess interference in CD1a binding of the AF647-conjugated antibodies. Greyscale shows degree of binding, with the tone in the top row (−) indicating no interference. Representative of 3 independent experiments. B Matrix heatmap representation of CD1a antibody binding to CD1a mutant proteins as represented by normalized CD1a-AF647 MFI. Biotinylated CD1a mutant proteins and wild-type CD1a proteins were conjugated to streptavidin magnetic beads and binding of the panel of AF647-conjugated anti-CD1a antibodies was determined by flow cytometry. Greyscale shows degree of binding as a percentage of parent CD1a minor allele. Examined over 4 independent experiments. C Summary of CD1a mutants that affect binding of anti-CD1a antibodies OX77a, OX111, OX16, OX110. The top surface of CD1a (grey) is formed by α 1 and α 2 helices. The approximate area of A’ roof/F’ portal is marked with pink and cyan bars. The side chains of residues mutated to alanine are shown in magenta (A’ roof) or cyan (F’ portal). Mutated residues that had a negative impact on binding to the corresponding Ab are labelled and their surface is coloured in red.

