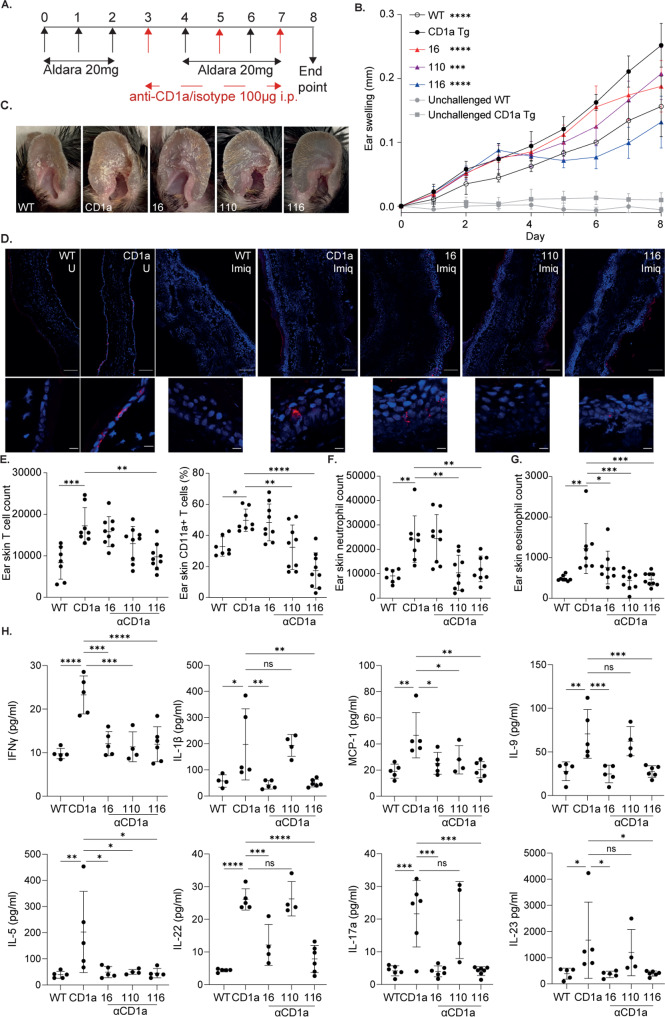
Fig. 6. Application of anti-CD1a antibodies in the treatment of imiquimod-induced inflammation.
A Schematic of imiquimod-induced inflammation with therapeutic anti-CD1a administration. B Daily measurement of ear swelling. n = 4 (WT), n = 6 (CD1a), n = 8 (16), n = 8 (110), n = 10 (116), n = 2 (WT unchallenged), n = 6 (CD1a unchallenged), examined over 3 independent experiments. Two-way-ANOVA with Dunnett’s test, ***P < 0.001; ****P < 0.0001 indicates significance at day 6 on comparison to “CD1a”. C Representative images of inflammation (day 8) induced by imiquimod treatment of wild-type (WT) and CD1a transgenic mice (CD1a Tg) followed by the treatment i.p. with mouse IgG1 isotype control or CD1a transgenic injected with the refined panel of anti-CD1a antibodies as in the schematic panel A (at day 3 arrowpoint). D Whole ear (upper panels) and epidermal (lower panels) thickness and CD1a protein expression within ear skin of wild-type (WT) and CD1a transgenic (CD1a) mice treated with imiquimod (Imiq) or untreated (U) visualized by immunofluorescence. Cryosections were stained with DAPI (blue) and anti-CD1a AF-594 (OKT6, red), scale bars 10 µm upper panels and 100 µm lower panels. Data shown representative of 2 independent experiments. E–G Flow cytometric analysis of ear skin of mouse IgG1 isotype treated wild-type (WT) and CD1a transgenic (CD1a) and CD1a transgenic injected with the refined panel of anti-CD1a antibodies following the treatment model of administration. Skin T cells were enumerated (/ear) and assessed for cell surface CD11a expression (E) and neutrophil (F) and eosinophil (G) enumerated (/ear). E–G n = 7 (WT), n = 8 (CD1a), n = 9 (16, 110, 116), examined over 3 independent experiments. One-way-ANOVA with Dunnett’s test, *P < 0.05; **P < 0.01; ***P < 0.001; ****P < 0.0001. H Skin cytokine levels of mouse IgG1 isotype treated wild-type (WT) and CD1a transgenic (CD1a); and CD1a transgenic injected with anti-CD1a antibodies following the treatment model of administration as measured by cytometric bead array. n = 5 (WT, CD1a, 16), n = 4 (110), n = 6 (116), examined over 3 independent experiments. One-way-ANOVA with Dunnett’s test, *P < 0.05; **P < 0.01; ***P < 0.001; ****P < 0.0001. Mean ± SD is shown. n represents biologically independent animals in each group. Exact p-values are recorded in Supplementary Table 5. Source Data are provided as a Source Data file.

