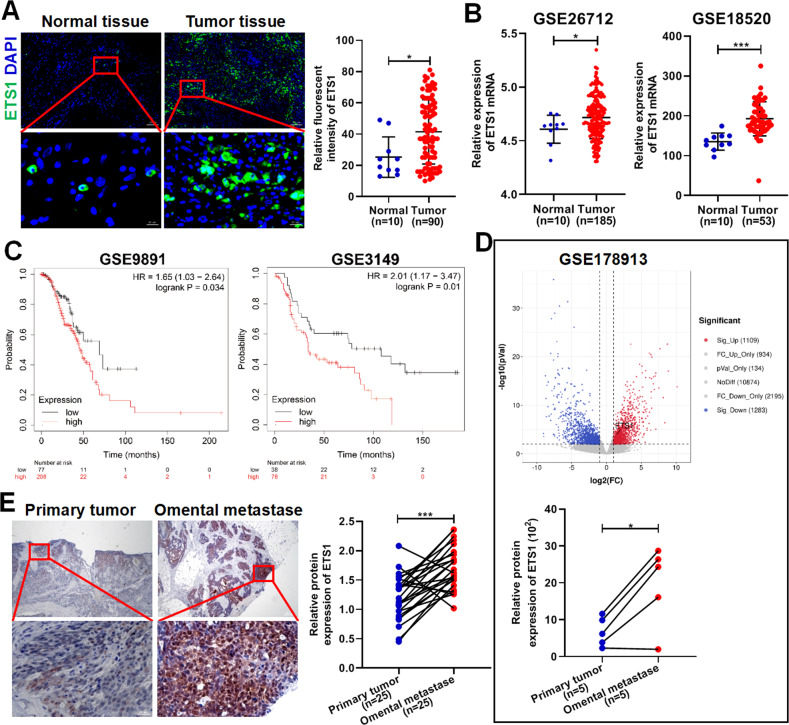
Fig. 1. ETS1 is highly expressed in ovarian cancer omental metastases.
A Representative immunofluorescence (IF) staining of ETS1 (green) and DAPI (blue) in ovarian cancer tissues and normal tissues. Scale bars: 100 μm at ×100 magnification; 20 μm at 630× magnification. B Expression of ETS1 mRNA in the ovarian cancer tissues and normal tissues from the GSE26712 and GSE18520 datasets. C Kaplan–Meier plots showing the overall survival of ovarian cancer patients from the GSE9891 and GSE3149 datasets based on ETS1 mRNA expression. D Volcano plot showing the differentially expressed genes between five pairs of the ovarian primary tumor and corresponding omental metastases, and the bottom graph showing the expression of ETS1 mRNA in the ovarian primary tumor and corresponding omental metastases from the GSE178913 database. E Representative immunohistochemistry (IHC) staining of ETS1 in ovarian primary tumors and corresponding omental metastases. Scale bars: 200 μm at ×40 magnification; 20 μm at ×400 magnification. Data are shown as mean ± SD. *P < 0.05, ***P < 0.001.

