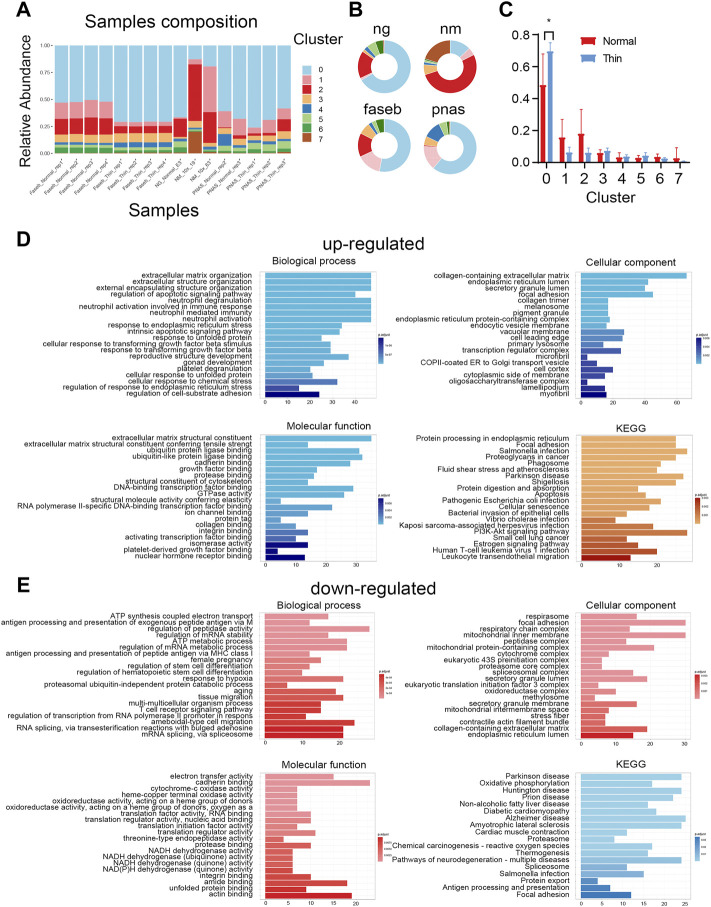
FIGURE 2.
Differential cell population in thin endometrial tissue. (A) The cell type composition for each sample. (B) The sample profiles in individual projects. (C) The proportions of cell types in normal and thin endometrial tissues. *p < 0.05. The functional annotation for the upregulated (D) and downregulated (E) DEGs in stromal cells.

