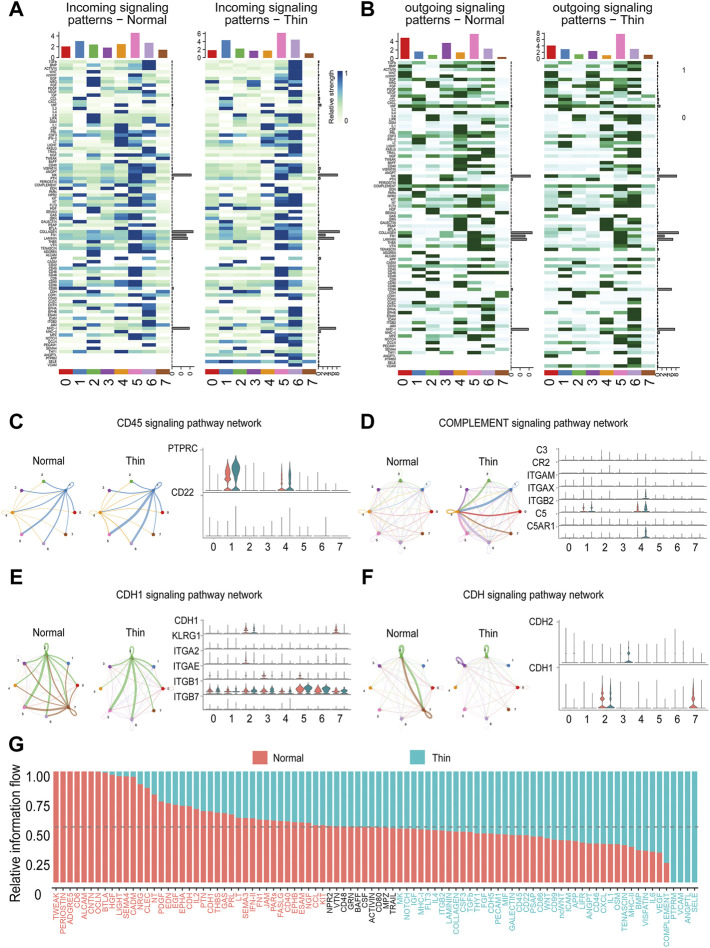
FIGURE 5.
Dysfunctional cell-cell communication in thin endometrium. Heatmap depicting differential incoming (A) and outgoing (B) signaling patterns in each cluster. Representative networks for enhanced (C,D) and reduced (E,F) signaling pathways. Left, circle plot showing the signals in cell-cell interactions between normal and thin endometrium; right, the expression level of ligand-receptor genes in individual signals. (G) Bar graph demonstrating the relative information flow of each signaling pathway between normal and thin endometrial tissues.

