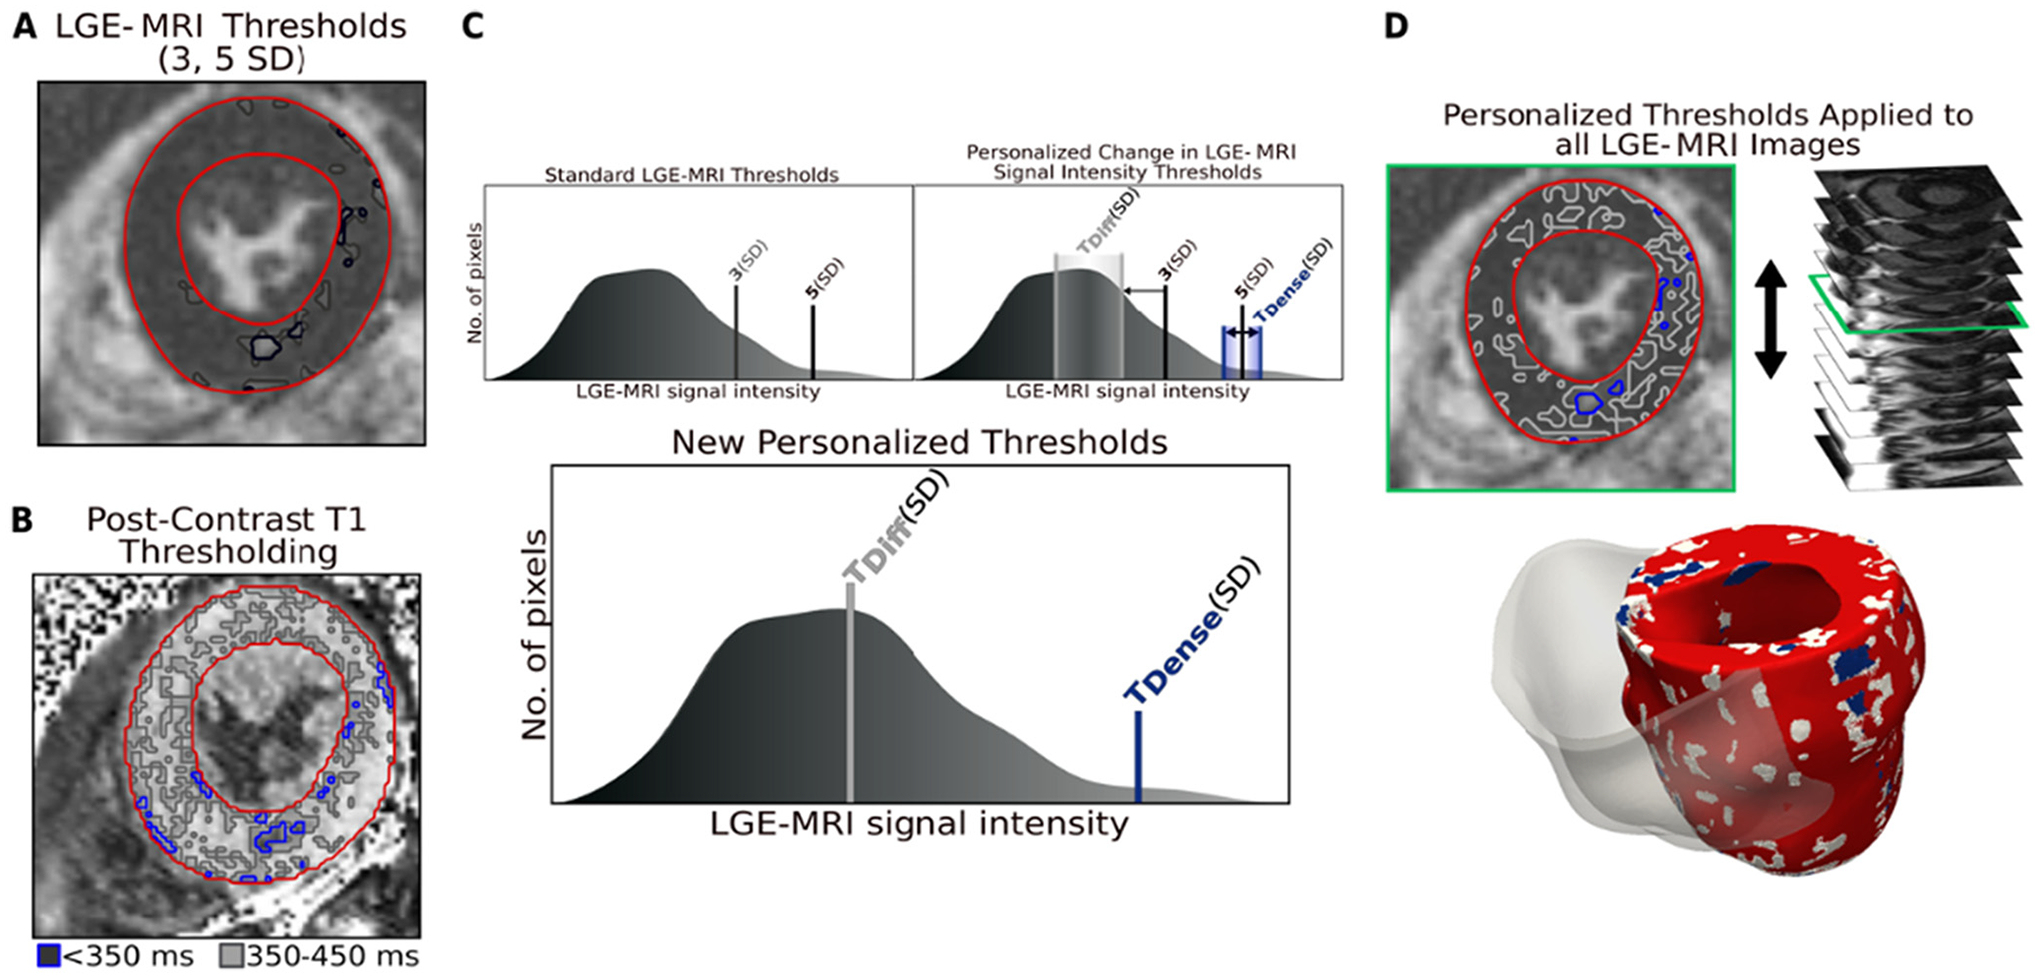
Fig. 1.

Combining LGE-MRI with Post-Contrast T1 Mapping. A. Segmentation of short-axis LGE-MRI myocardium. B. Segmentation of T1 map myocardium and thresholding of diffuse fibrosis (gray) and dense fibrosis (blue). C. Top left: Standard thresholds for gray zone and focal scar in the ischemic population, applied to the LGE-MRI segmentation from the mean of the low signal myocardium in (A). Top right: Representation of the change in thresholds based on distribution in (B). Bottom: The new personalized thresholds for fibrosis for this patient. D. Top: Application of personalized thresholds to each image in the LGE-MRI short-axis. Bottom: Personalized geometrical reconstruction of the LGE-T1 virtual heart. SD: standard deviation; LGE-MRI: late gadolinium enhanced magnetic resonance imaging.
