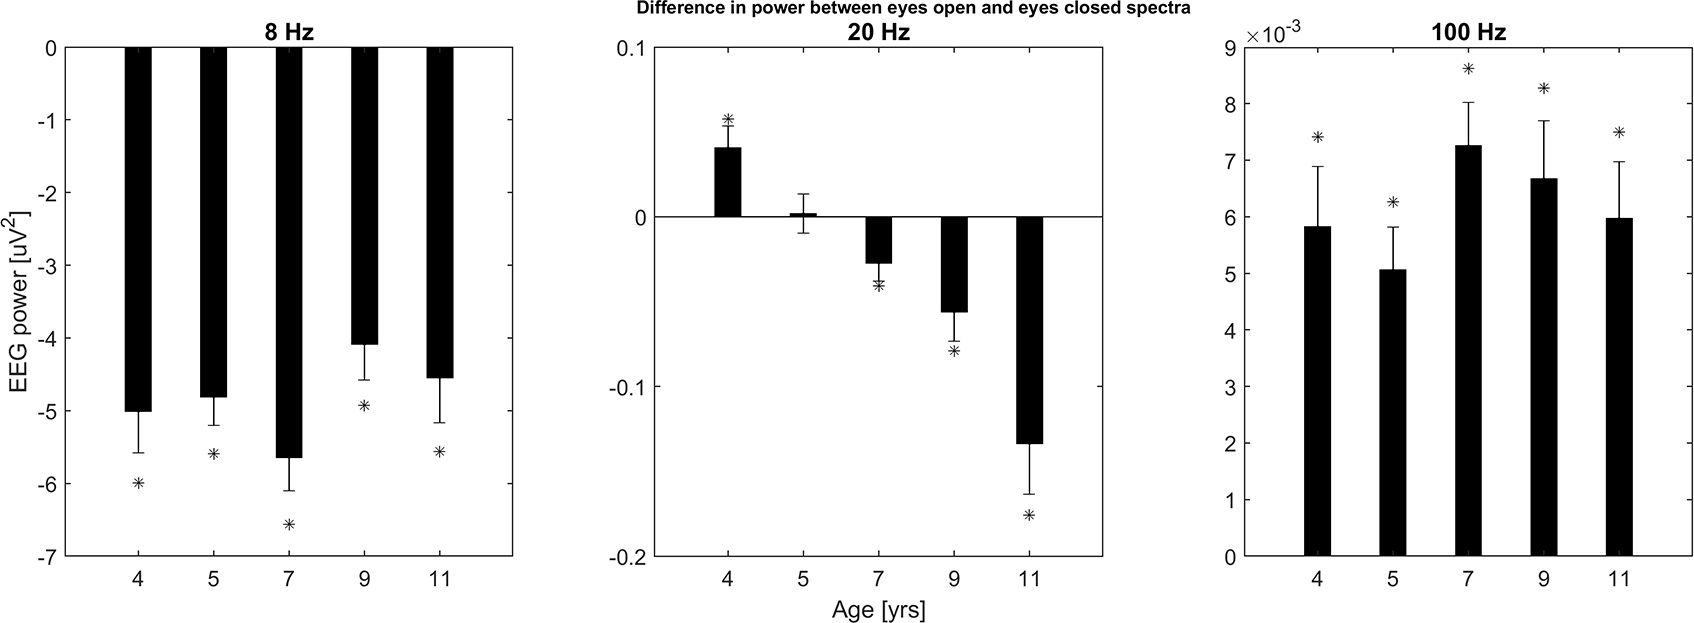
Figure 2.

Developmental changes of differences between spatially-averaged spectral bands (EO - EC) are shown with bar plots at each of the five ages. Bands were 3 Hz wide, (subpanels, labeled by center frequency, 8, 20, and 100 Hz). Bands with significant EC vs EO differences are marked with asterisks, all of which remained significant after applying a Bonferroni adjustment to alpha.
