Figure 2.
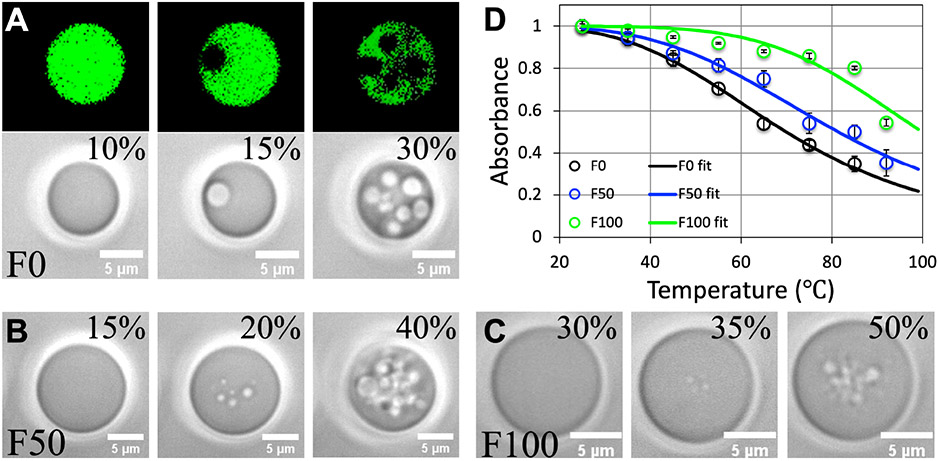
Increase in pK:H condensate melting temperature by Ficoll70. (A) Fluorescence and brightfield images showing condensate local melting above a 15% threshold of laser power at 0 Ficoll70. (B) Melting starts at 20% laser power in the presence of 50 g/L Ficoll70. (C) The threshold laser power increases to 35% at 100 g/L Ficoll70. For (A-C), the laser power was evenly split between two beams and each was used to trap a droplet (see Supporting Information, Movies 1-3); images of only one droplet are shown. (D) Melting curves from turbidity assay. Data are presented as mean ± standard error of the mean (N = 3-6 replicate measurements); curves show fits.

