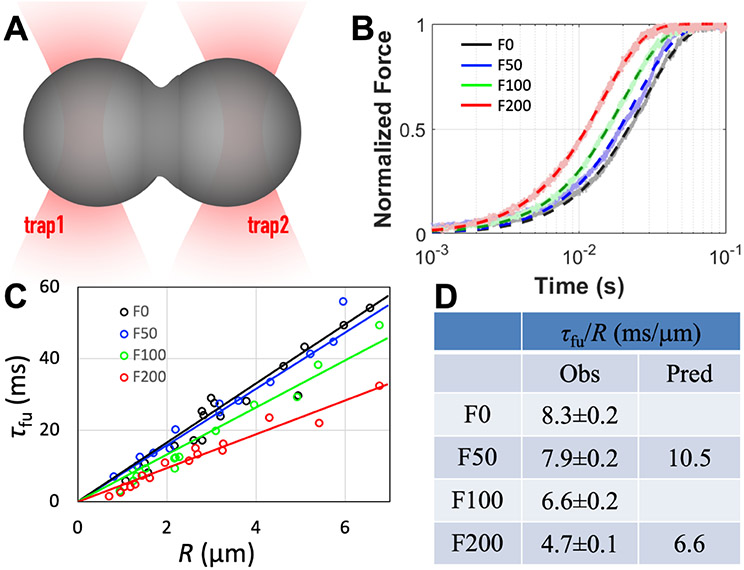
Figure 5.
Increase in pK:H droplet fusion speed over the Ficoll70 concentration range of 0 to 200 g/L. (A) Fusion dynamics monitored by dual optical traps. The laser power was evenly split between two beams and set at 3%. (B) Traces of normalized trap 2 forces from pairs of fusing droplets with a ~3 mm initial radius. Raw data are shown as dots while fits are shown as dashed curves. (C) Dependences of fusion time (τfu) on droplet radius (R). Circles show data from individual pairs of fusing droplets while lines show fits. The slope, τfu/R, of each line is the inverse fusion speed. (D) Inverse fusion speed. Observed results are presented as fitted value ± standard error of the fit; predicted values are according to eq [3]. The result at 50 g/L Ficoll70 was reported previously 17 but was redetermined here.

