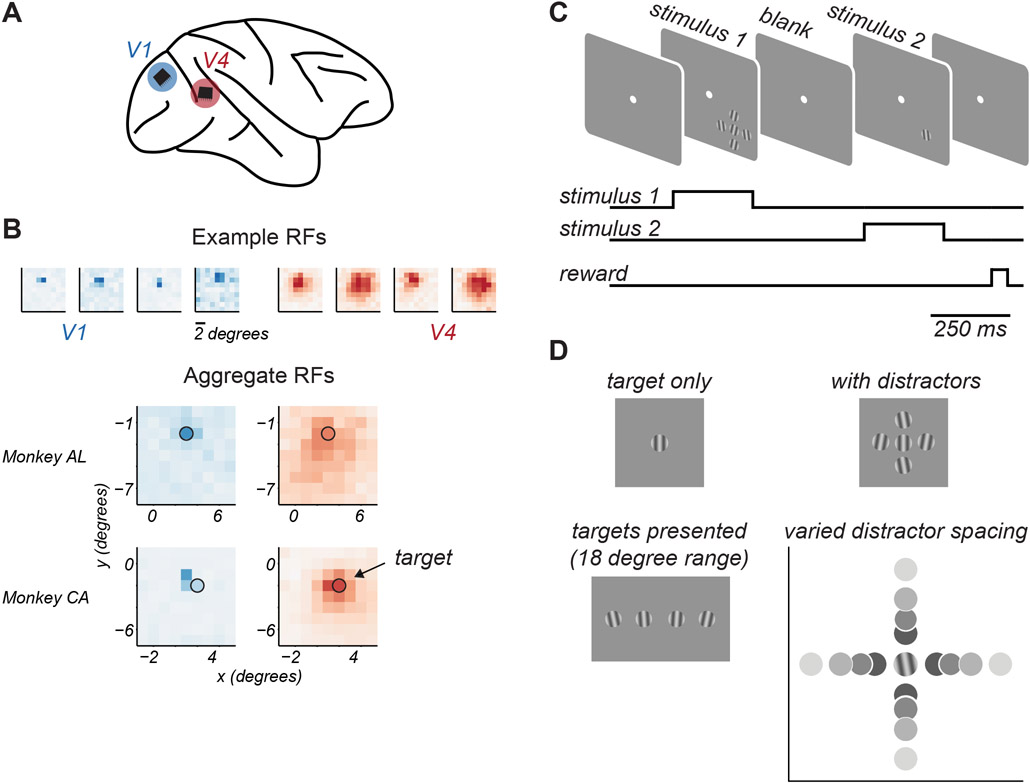
Figure 1. Experimental approach.
A. Microelectrode arrays were chronically implanted into V1 and V4 of one hemisphere of each animal. B. Top. Spatial receptive field maps of 4 example neurons from V1 (blue) and V4 (red). Darker colors indicate higher firing rates. Bottom. Aggregate receptive field maps of recorded neuronal populations, by cortical area (columns) and animal (rows). Black circle indicates target stimulus location and approximate size. C. Task structure. Animals maintained fixation of a central spot while target stimuli were presented in two 0.25s epochs on each trial, separated by a 0.35s blank period. D. Target stimuli were drifting gratings chosen from an 18 degree range around a reference orientation. When shown, distractors were presented at ±10 deg relative to this reference orientation. Target-distractor spacing was varied.

