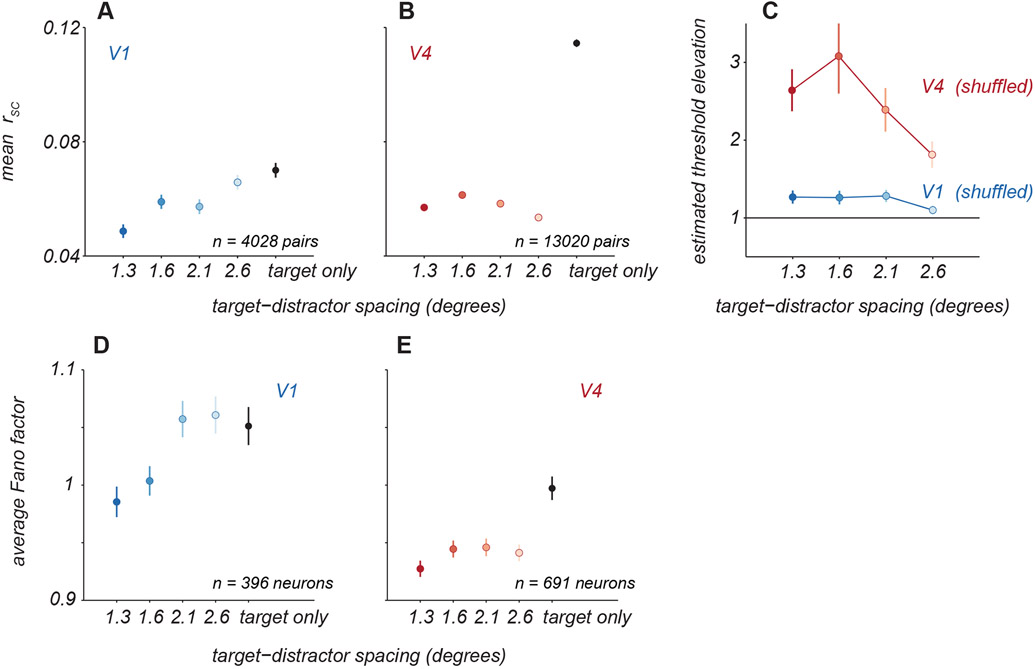
Figure 3. Effect of distractors on neuronal variability.
A. Average pairwise ‘noise’ correlations (rSC) for V1 neuronal pairs for targets alone (black) and with distractors of varied spacing (blue). Points and error bars represent mean ± s.e.m. B. Average correlations for V4 neuronal pairs, same conventions as in A. C. Crowding effect size for V1 and V4 populations when decoding was performed on trial-shuffled population activity. Points and error bars represent mean ± s.e.m. D. Individual neuron variability was quantified as the average Fano factor for V1 neurons for targets alone (black) and with distractors at various spacings (blue). Points and error bars represent the geometric mean ± s.e.m. over all neurons. E. The average Fano factor for V4 neurons, same conventions as in A.

