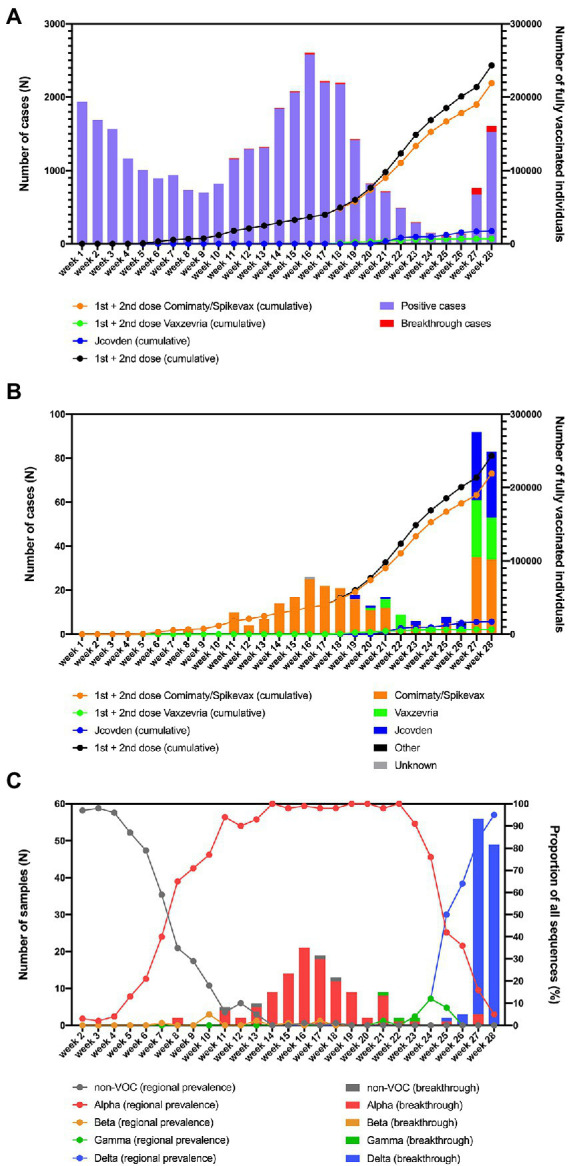
Figure 1.

(A) Overview of the number of fully vaccinated individuals and breakthrough infections in function of time in the region of South Limburg. (B) Breakthrough infections per vaccine in function of time. (C) Evolution of the prevalence of Non-VOC and VOC lineages in the community (lines) as well as the distribution of variants causing breakthrough infections (bars) in function of time in the region of South Limburg. The numbers represented by bars are plotted on the left y-axis, while the numbers represented by dots/lines are plotted on the right y-axis.
