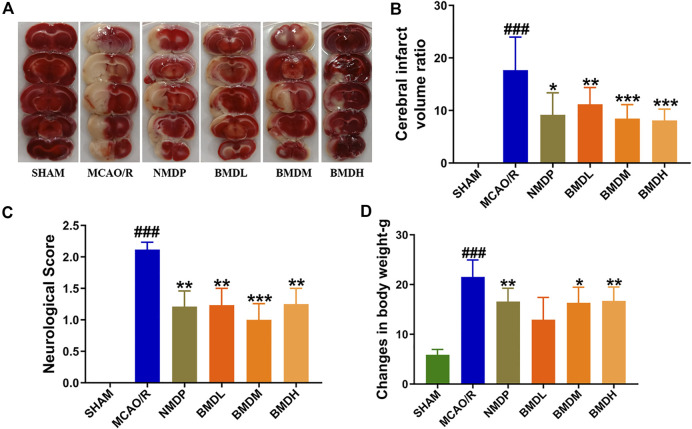
FIGURE 1.
Cerebral infarction evaluation (n = 8). (A) TTC staining of brains. (B) Cerebral infarct volume ratio examination. (C) Neurological deficit score assessment. (D) Changes in body weight determination. Data were expressed as the mean ± SD. * p < 0.05, ** p < 0.01, *** p < 0.001 relative to the MCAO/R group; ### p < 0.001 relative to the SHAM group.

