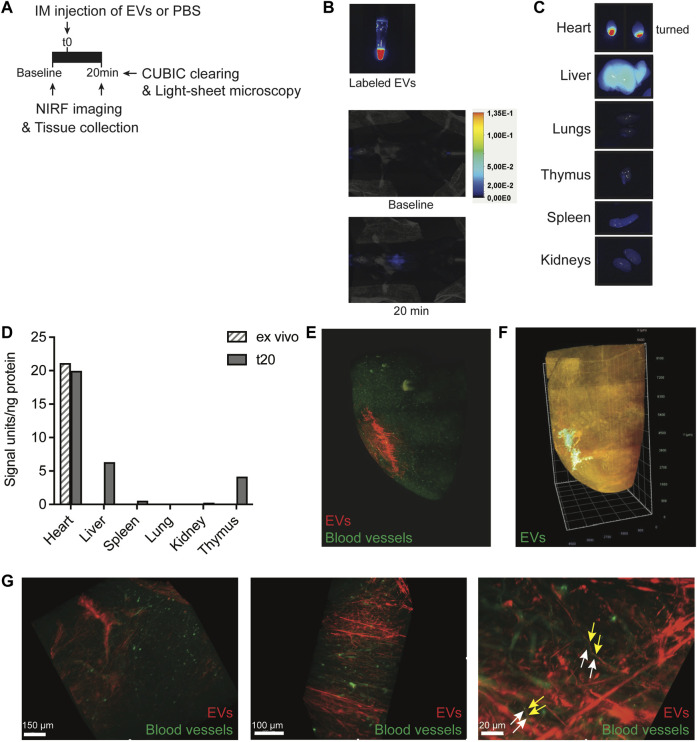
FIGURE 2.
Short-term EV biodistribution after intramyocardial injection. (A) Schematic overview of EV administration and near-infrared (NIRF) imaging directly or at 20 min after intramyocardial injection (IM) of 5 μL EVs in the left ventricle. (B) NIRF images taken from the Eppendorf containing labeled EVs and living animal at baseline and 20 min after intramyocardial EV administration. (C) NIRF images of individual organs collected after termination. Uncut images are included in Supplementary Figure S11. (D) Quantification of fluorescence (800 nm) per ng protein in organ lysates as compared to organ background. An ex vivo heart injected with 5 μL EVs was included as control. (E,F) Snap-shots of 3D fluorescent images of the heart injected with (E) 2.5 × 10¹⁰ or (F) 1.75 × 10¹⁰ AlexaFluor647 NHS ester-labeled EVs, generated after CUBIC tissue clearing and subsequent light-sheet fluorescent microscopy. Images represent two independent experiments. (E) Heart was perfused with Lectin-FITC to stain blood vessels before tissue collection. Snapshots at higher magnification are displayed in (G). Arrows indicate no co-localization of (yellow) EVs and (white) blood vessels.

