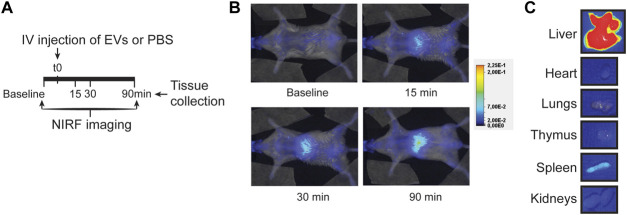
FIGURE 5.
EV distribution in the mouse after intravenous injection. (A) Schematic overview of EV administration and NIRF imaging up to 90 min after tail vein injection. (B,C) Representative NIRF images taken (B) from the living animal at various time points after EV administration and (C) of individual organs collected after 90 min follow-up. Uncut images are included in Supplementary Figure S11.

