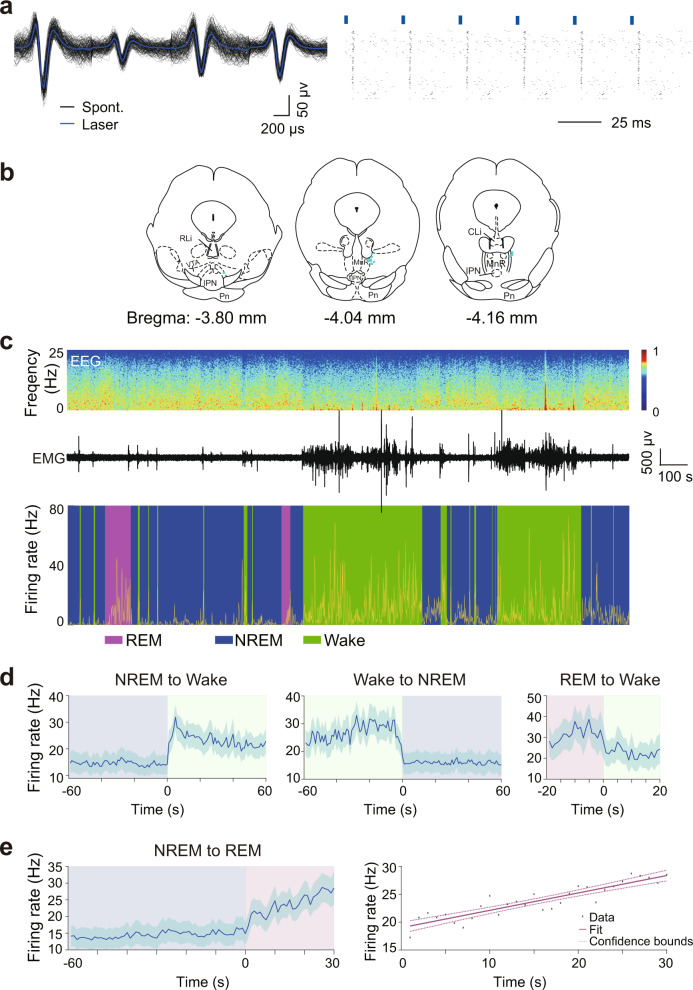
Fig. 4. Firing rates of identified RMTg GABAergic neurons across brain states.
a An example unit. Comparison between laser-evoked (blue) and spontaneous (black) spike waveforms from this unit (left). Spike raster showing multiple trials of laser stimulation at 30 Hz. Blue ticks, laser pulses (right). b Recording sites of 12 identified units across the rostrocaudal extent of the RMTg in VGAT-Cre mice. Each indigo dot indicates one unit. c Firing rates of an example RMTg GABAergic neuron (yellow) together with the EEG spectrogram, EMG amplitude, and color-marked brain state. d Mean firing rates of all identified GABAergic neurons at sleep–wake state transitions. e Firing rate changes of identified RMTg GABAergic neurons from NREM to REM sleep transition (left) and linear regression of firing frequency of all identified units during the initial 30 s of REM sleep (right). Dashed line: confidence bounds (R2 = 0.819, p < 0.01). Shading indicates 95% confidence intervals (d, e). n = 12 units from 3 mice. Source data are provided as a Source Data file.

