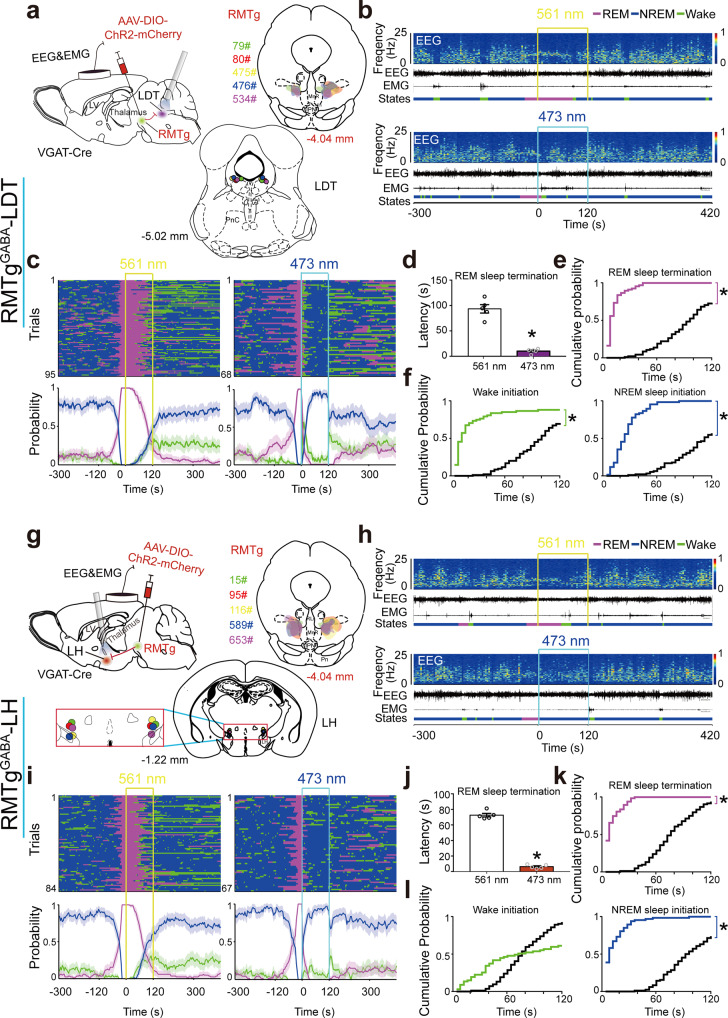
Fig. 5. The RMTgGABA-LDT and RMTgGABA-LH circuits mediated distinct REM sleep transitions.
a, g Diagram of experiments for in vivo optogenetic stimulation of RMTg GABAergic terminals in the laterodorsal tegmentum (LDT) (a) or lateral hypothalamus (LH) (g). Schematic illustration of adeno-associated virus (AAV) encoding channelrhodopsin 2 (ChR2) fused to an enhanced red fluorescent protein mCherry delivered into the bilateral RMTg in VGAT-Cre mice (top left). The coronal section shows the superimposed virus-injected area (top right) and tips of optical fibers (bottom). b, h Representative EEG and EMG traces and corresponding heat map of the EEG power spectrum in different sleep–wake states induced by laser stimulation of the RMTgGABA-LDT (b) and RMTgGABA-LH (h). Top, control group with 561 nm laser stimulation. Bottom, 473 nm laser stimulation. c, i Sleep–wake state changes (top) and probability of brain state transitions (bottom) after photostimulation of RMTg GABAergic axons in the LDT (c) or LH (i) during REM sleep lasting no less than 16 s before laser on in all trials from mice in each of these two circuit groups with 561 nm laser stimulation as the control (left) and 473 nm laser stimulation (right), respectively. Shading indicates 95% confidence intervals. Yellow and blue lines, 561 nm and 473 nm laser stimulation (30 Hz, 120 s, 10 ms pulse), respectively (b, c, h, i). d–f, j–l During 120 s laser stimulation of the RMTgGABA-LDT (d–f) and RMTgGABA-LH (j–l), mean latency of REM sleep transitions to wakefulness or NREM sleep after blue laser stimulation during REM sleep in the first eight trials per mouse. p = 0.0312 vs. control group, Wilcoxon test (d, j); cumulative probability of REM sleep termination, wake and NREM sleep initiation. *p < 0.05 for comparison between 473 nm laser stimulation and 561 nm control group, Kolmogorov–Smirnov test. Colorful stairs, group with 473 nm laser illumination. Black stairs, control group with 561 nm laser illumination (e, f, k, l). Data represent mean ± SEM. n = 5 for the circuits of RMTgGABA-LDT or RMTgGABA-LH. Source data are provided as a Source Data file.

