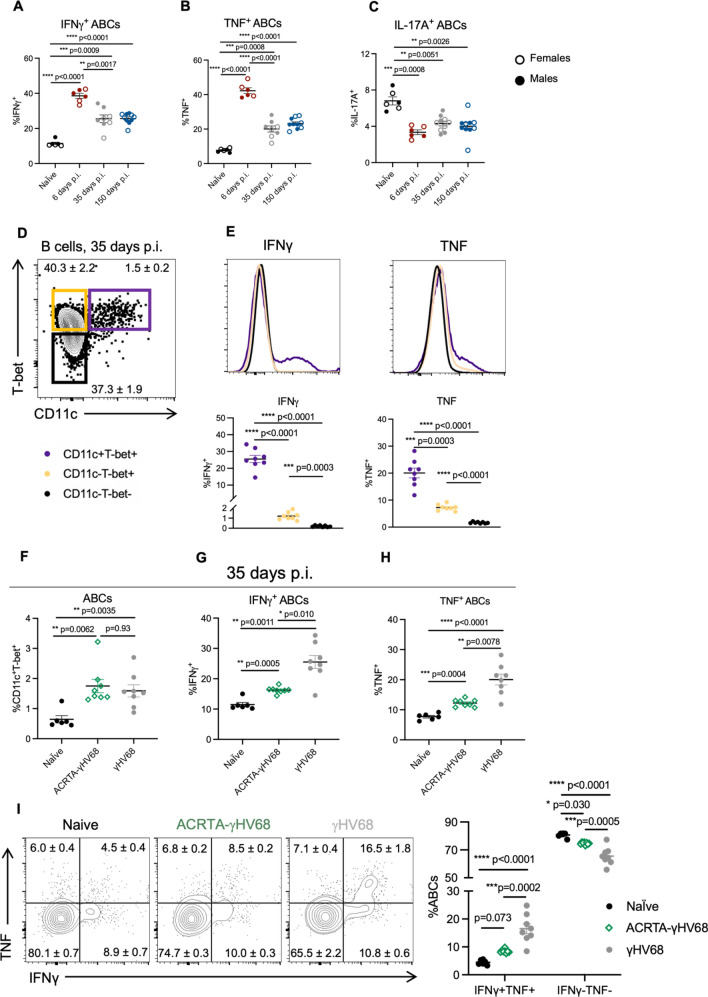
Figure 2.
Cytokine production by ABCs in the spleen during γHV68 and ACRTA-γHV68 infection. (A–C) C57BL/6(J) mice (6–8-week-old at infection) mock-infected with media (naïve) or infected i.p. with γHV68 for 6, 35, or 150 days. Spleens collected and processed for flow cytometry. Proportion of ABCs in the spleen expressing (A) IFNγ, (B) TNF, or (C) IL-17A, with females presented as open circles and males as filled circles. (D) Gating of ABCs (CD11c+T-bet+) and non-ABC B cells (CD11c−T-bet+ and CD11c−T-bet−), previously gated on CD19+IgD− cells in the spleen. (E) Representative histograms and dot plots of the proportion of ABCs and non-ABC B cells (CD11c−T-bet+ and CD11c−T-bet−) expressing IFNγ and TNF from mice infected with γHV68 for 35 days. (F–H) C57BL/6(J) mice mock-infected with media (Naïve, black circles) or infected i.p. with γHV68 (grey circles) or ACRTA-γHV68 (green diamonds) for 35 days and spleens processed for flow cytometry. (F) Proportion of ABCs (CD11c+T-bet+) of previously activated B cells (CD19+IgD−) in the spleen. Proportion of ABCs (CD19+CD11c+T-bet+) in the spleen expressing (G) IFNγ or (H) TNF. (I) Representative plots and quantification of the proportion of ABCs expressing IFNγ and TNF. Equivalent numbers of females and males per group in all panels. (A–C) n = 6–10 mice per group, data combined from two experiments. (E–I) n = 6–8 mice per group, representative of two experiments. Each data point represents an individual mouse. Data presented as mean ± SEM. Analyzed by one-way ANOVA. p-values indicated as asterisks as follows: ****p < 0.0001, ***p < 0.001, **p < 0.01, *p < 0.05.

