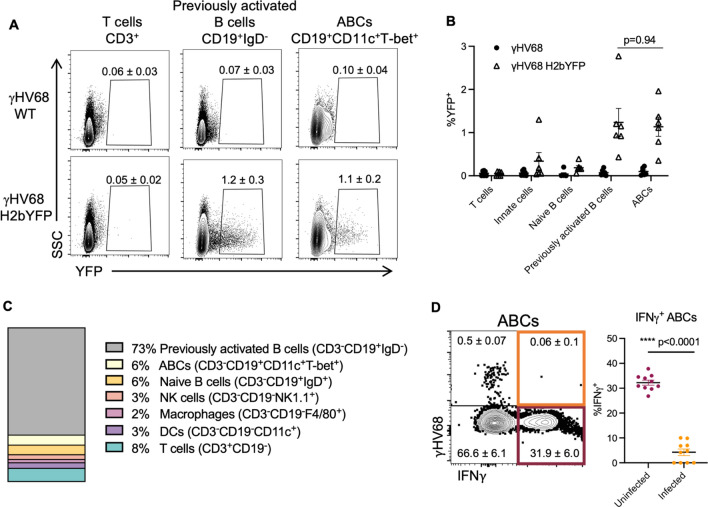
Figure 3.
Analysis of ABC infection status with fluorescent γHV68 strain. Female C57BL/6(J) mice (6 to 8-week-old at infection) infected i.p. with γHV68 or γHV68.H2bYFP. 8 days p.i. spleen collected and processed for flow cytometry. (A) Representative flow cytometry plots displaying yellow fluorescent protein (YFP) expression (x-axis) versus side-scatter (SSC, y-axis) from mice infected with γHV68 or γHV68.H2bYFP with mean ± SEM. Samples gated on live, single lymphocytes, and then T cells (CD3+), total B cells (CD19+), previously activated B cells (CD19+IgD−), or ABCs (CD19+CD11c+T-bet+). Two samples per group concatenated for the purpose of visualization. Representative of two experiments. (B) Proportion of cell subsets positive for YFP expression from γHV68-infected mice (filled circles) and γHV68.H2bYFP-infected mice (open triangles). Each data point represents an individual mouse. (C) Proportion of YFP+ cells that are non-B cells (CD19−, white), non-ABC B cells (CD19+CD11c−T-bet−, grey), or ABCs (CD19+CD11c+T-bet+, black). Data n = 6 mice per group, data compiled from two experiments, representative of three experiments. (D) Representative flow plot of ABCs (CD19+CD11c+T-bet+) in the spleen gated for YFP (γHV68.H2bYFP) and IFNγ with mean ± SEM. Dot plot displays the proportion of either uninfected (YFP−) or infected (YFP+) ABCs in the spleen that are positive for IFNγ. (B,D) Data presented as mean ± SEM, analyzed by Mann–Whitney test. Each data point represents an individual mouse. p-values indicated as asterisks as follows: ****p < 0.0001.

