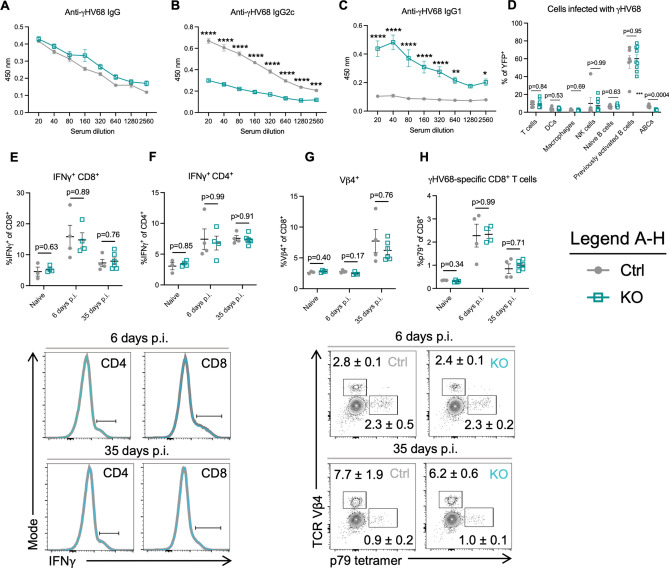
Figure 5.
Mice without ABCs display a dysregulated anti-γHV68 antibody response, though no alterations to the cell populations infected with γHV68 or γHV68-responding T cells, compared to mice with ABCs. (A–C) Tbx21fl/flCd19+/+ (Ctrl, filled grey circles) and Tbx21fl/flCd19cre/+ (KO, open blue squares) mice were infected i.p. with γHV68 for 35 days. N = 5 per group, representative of 2 experiments. (D) Ctrl and KO mice were infected i.p. with γHV68.H2bYFP for 8 days, and various immune cell populations in the spleen analyzed for YFP expression. N = 6–8 per group, data compiled from 2 experiments. (E–H) Ctrl and KO mice were infected i.p. with γHV68 for 6 or 35 days, at which point spleens were collected for flow cytometry. Representative of 2 experiments. Flow cytometry plots are representative samples previously gated on live (E,F) CD45+CD3+ or (G,H) CD45+CD3+CD8+ splenocytes, with mean ± SEM. Each data point represents an individual mouse. Both male and female mice included in experiments. Data presented as mean ± SEM. Analyzed by two-way ANOVA (A–C) or Mann–Whitney test (D–H). p-values indicated as asterisks as follows: ****p < 0.0001, ***p < 0.001, **p < 0.01, *p < 0.05.

