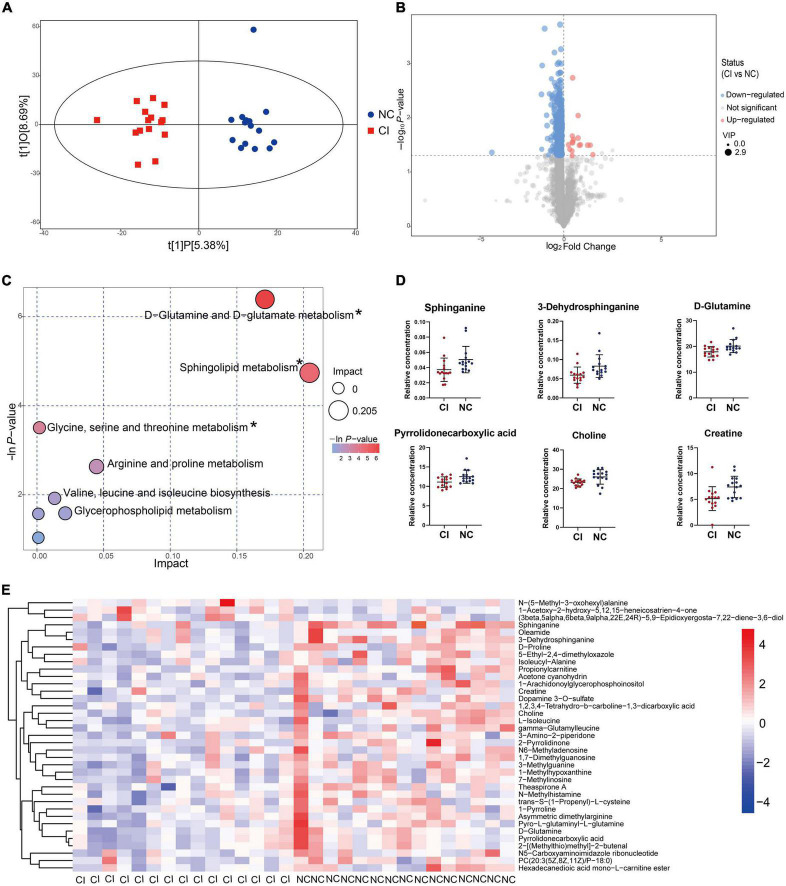
FIGURE 5.
Metabolic difference between cognitive impairment and cognitively normal groups. (A) Score scatter plot of the OPLS-DA model. (B) Volcano plot for different metabolites. (C) Bubble plot showing metabolic pathways. (D) Key metabolites in the significantly enriched metabolic pathways. (E) Different metabolites previously identified. *P < 0.05.

