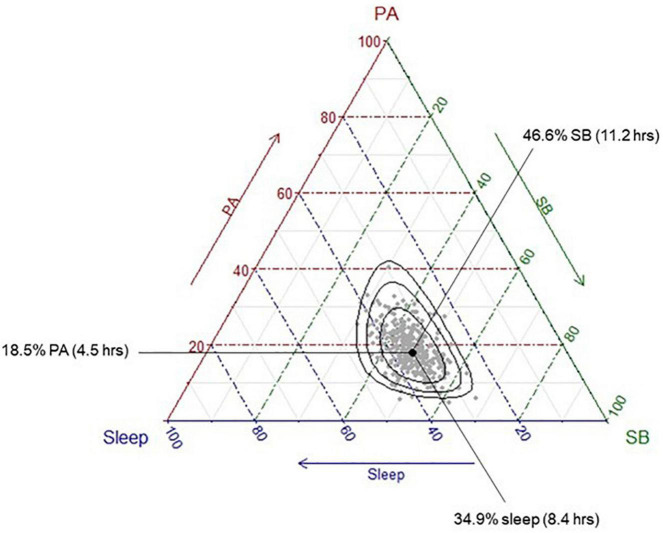
FIGURE 1.
Distribution of the sample time-use compositions. Each grey dot represents a single participant’s time-use composition. The black dot represents the average time-use composition of the sample, calculated as the geometric means of each activity, collectively adjusted to sum to 1,440 min. This differs to the arithmetic means, which are presented in Table 2; instead of summing the values and dividing by the number of values “n,” the geometric mean multiplies all the values and then takes the nth root. To convert the geometric mean to the compositional mean, the “closure” operator (a function part of Compositions package in R) is applied to the geometric mean, so that the centrality measure reflects the 1,440 min (24 h) in the day. The black dot represents this average composition (“compositional mean”) and shows that the average participant spends approximately 18.5% of their day in physical activity, 46.6% of their day in sedentary behaviour, and 35% of their day in sleep. Black ellipses represent 75, 95, and 99% confidence intervals, respectively.

