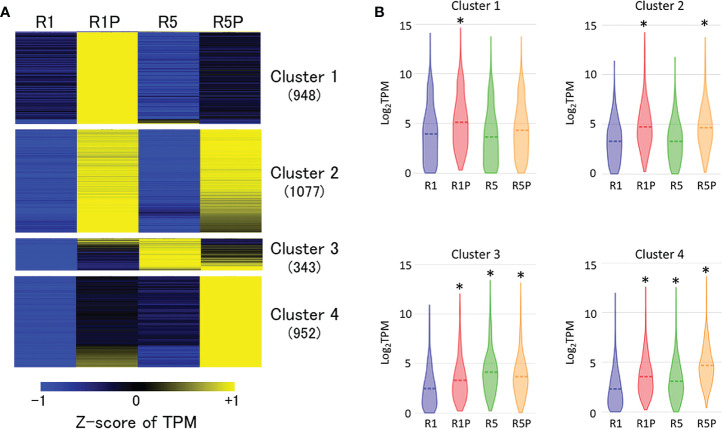
Figure 2.
Expression patterns of genes induced by PEG treatment. (A) K-means cluster analysis of 3,337 genes whose expression is significantly up-regulated at R1P compared to R1 (adjusted P < 0.05; Benjamini–Hochberg method, log2 fold change > 1). The number in the parentheses indicates the number of genes in each cluster. Z-score of TPM values was used to normalize each gene expression level. (B) Violin plots showing log2TPM values of genes in each cluster at R1, R1P, R5 and R5P (*P < 0.01, Steel–Dwass test, compared to R1). Dashed lines represent the mean value for each sample.

