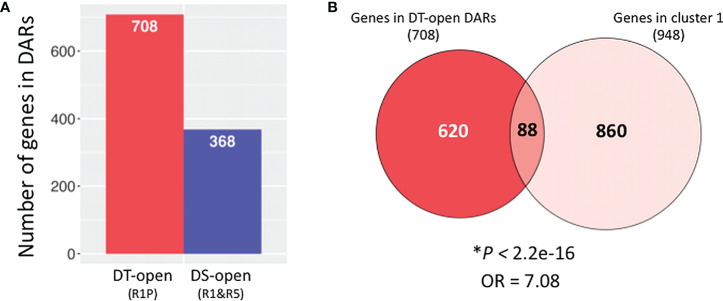
Figure 5.
Identification of genes in differentially accessible chromatin regions (DARs) between DT and DS germinating radicles. (A) Number of genes (1 Kb promoter + mRNA) present in DARs between DS (R1&R5) and DT (R1P) samples (adjusted P < 0.05; Benjamini–Hochberg method). (B) Venn diagrams show overlaps between genes in DT-DARs detected by ATAC-seq and genes belonging to cluster 1 detected by RNA-seq. Asterisks indicate significant overlap (P values from Fisher’s exact test; OR: odds ratio which represents the strength of association, with OR>1 corresponding to a strong association).

