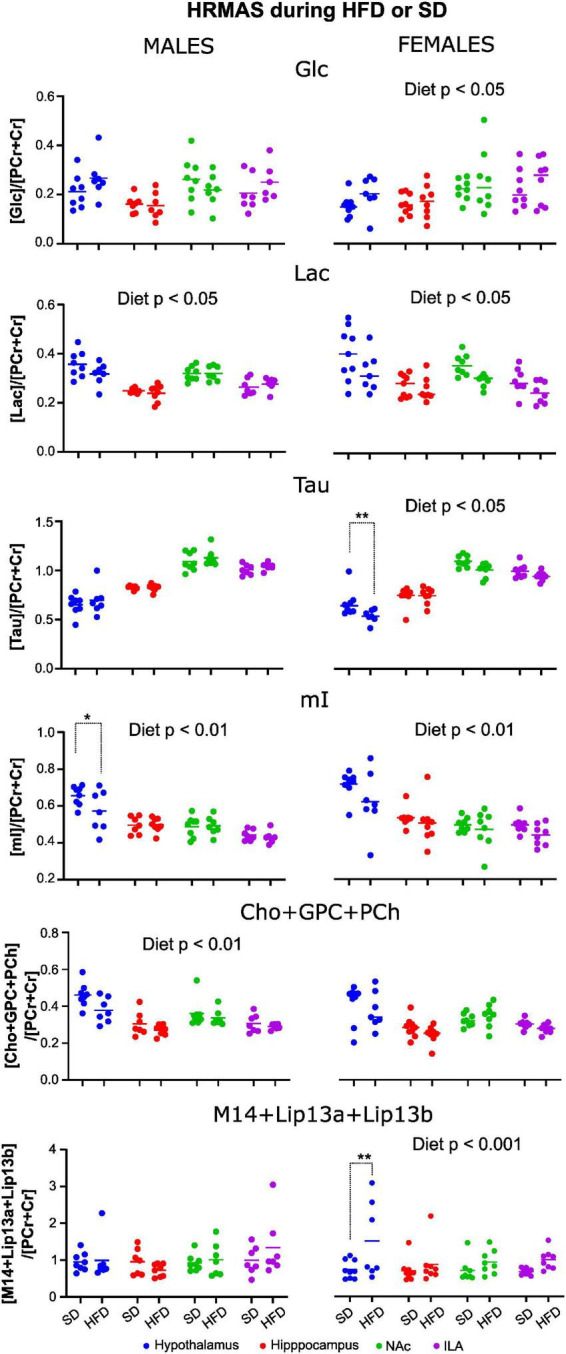
FIGURE 10.

Relative metabolite concentrations after 10 weeks of HFD or SD consumption in male and female mice. Values of metabolite concentration of male (left) and female (right) animals, fed under a SD or HFD relative to the total creatine resonance. Dots represent the relative concentration obtained for each individual animal, and the continuous line represents de mean value within a diet group. Only those metabolites with significant diet effects are shown. (*p < 0.05, **p < 0.01).
