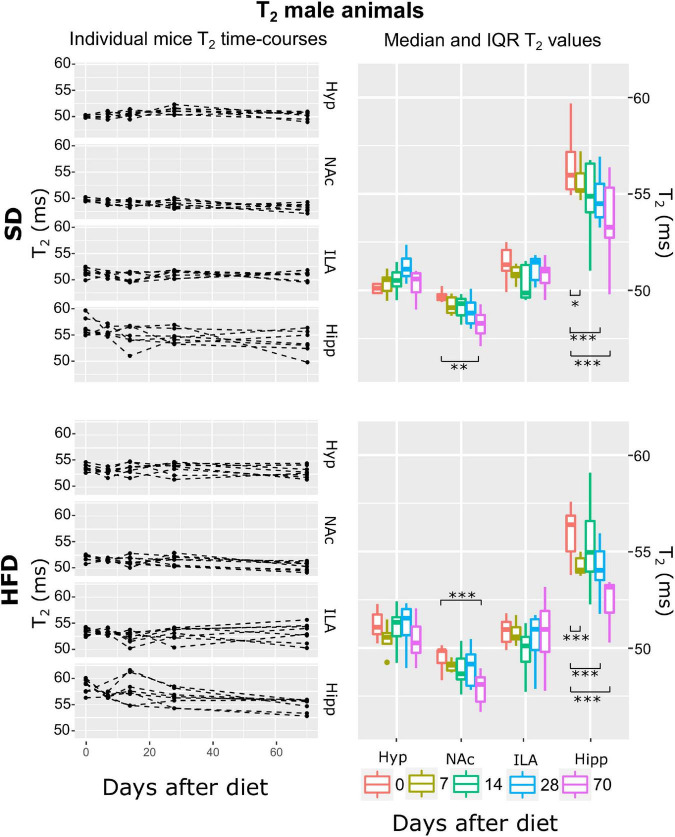
FIGURE 5.
T2 changes on male mice during HFD or SD consumption. T2 changes on SD-fed (top panels) or HFD (bottom panels) male mice in the four regions investigated: hypothalamus (Hyp), nucleus accumbens (NAc), ipsilateral area (ILA) and hippocampus (Hipp) at all time points measured. Left panels depict the individual T2 regional values at each time point, with dashed lines connecting the adjacent points. Right panels illustrate box plots of T2 vs. time-point for the 4 areas, with each color representing the specific time-point, as days after diet diversification. Note how T2 behaves similarly under both diets, with decreasing values on the NAc and hippocampus (*p < 0.05, **p < 0.01, ***p < 0.001).

