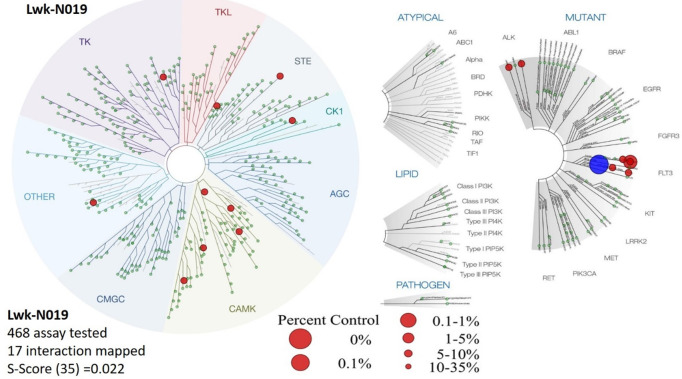
Figure 9.
Kinome-wide inhibition profile of Lwk-n019 at 10 µmol. Kinases showing ≤35 activities after Lwk-n019 treatment were mapped on a kinome tree. The sizes of the dots indicate the remaining activity of each kinase after inhibition. TREEspot™ was used to visualize interaction maps, and red circles indicate bound kinases. Larger circle sizes indicate higher binding affinities. S-score, selectivity score.

