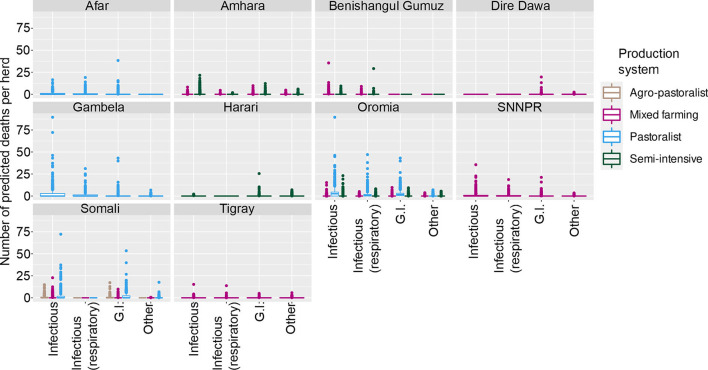
Figure 2.
Predicted number of cattle deaths in Farmer Survey from relationship between State, Disease and Production System. Number of deaths is shown in the y-axis; State is shown in the top of each box; Production System is represented by color as detailed in the legend; and Diseases (recoded) are shown along the x-axis. Each point represents a prediction for a single herd.

