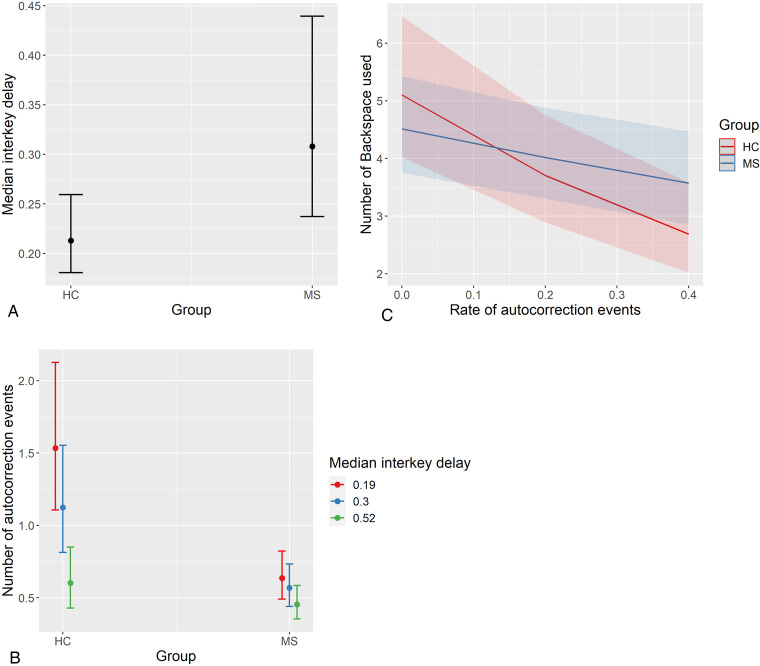
Figure 2.
Group differences in keystroke dynamics. Panel A displays differences between MS and HC groups in median interkey delay (typing speed); the MS group typed significantly slower. Panel B displays moderating effect of median interkey delay on number of autocorrection events (offset with number of characters per session); interkey delay is split into lower, median, and upper quartiles for visualization. The HC group had more autocorrection events than the MS group, but only among those who typed faster. Panel C displays the moderating effect of diagnostic group on the relationship between backspace and autocorrection rates; the relationship was steeper among HC than MS. Plots represent predicted values from multilevel models, and error bars/bands represent 95% confidence intervals. MS: multiple sclerosis; HC: healthy control.

