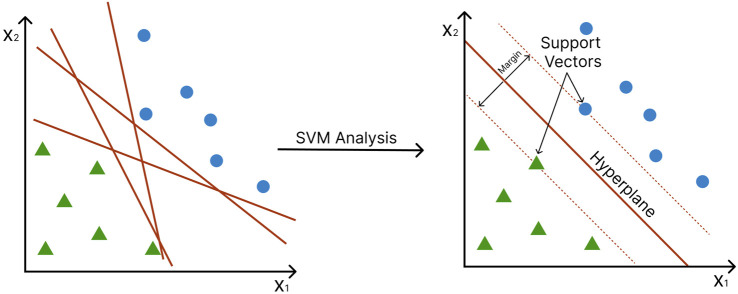
FIGURE 5.
Support Vector Machines (SVM) construct a hyperplane to separate data into two classes. Axes represent different features. Green triangles and blue circles represent different conditions (e.g., disease vs. control). The margin (red dotted line) is the distance between the hyperplane and the support vectors (the nearest data point of each class).

