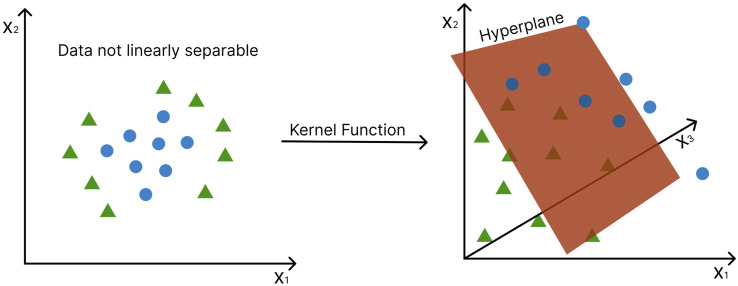
FIGURE 6.
The “kernel trick” - non-linearly separable data points are mapped into a higher dimensional feature space in which they become linearly separable. Axes represent different features. Green triangles and blue circles represent different conditions (e.g., disease vs. control). The hyperplane, in this case, becomes a two-dimensional plane.

