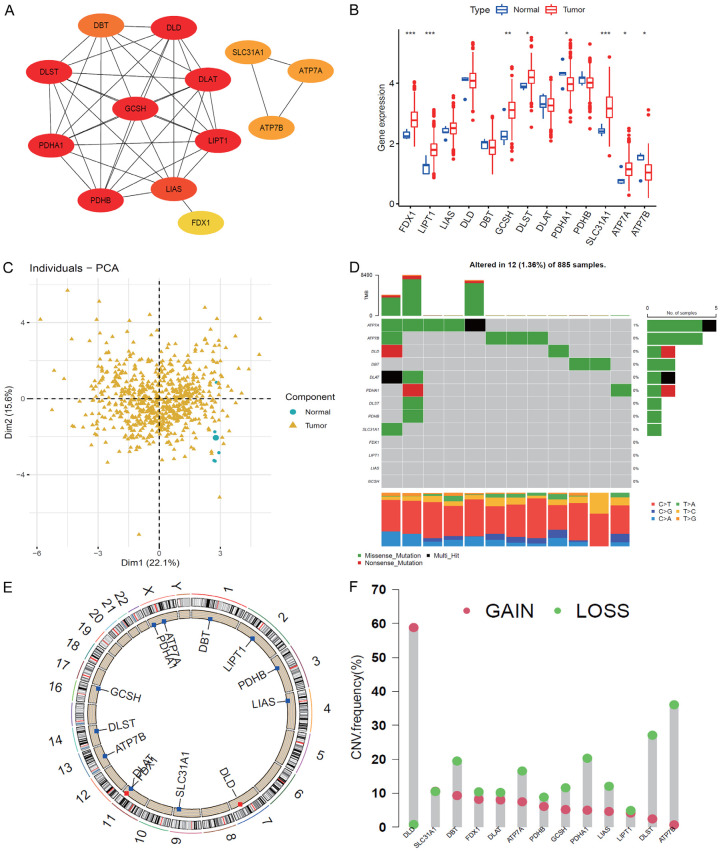
Figure 2.
Landscape of cuproptosis regulators. A: Protein-protein interaction network among cuproptosis regulators. B: Expression of cuproptosis genes between normal and tumor samples. C: Principal component analysis indicated the distributions of tumor and normal tissues. D: Frequency of cuproptosis genes. E: Location of cuproptosis regulators in chromosomes. F: Copy number variation (CNV) frequency of cuproptosis regulators in TCGA (Gain and Loss).

