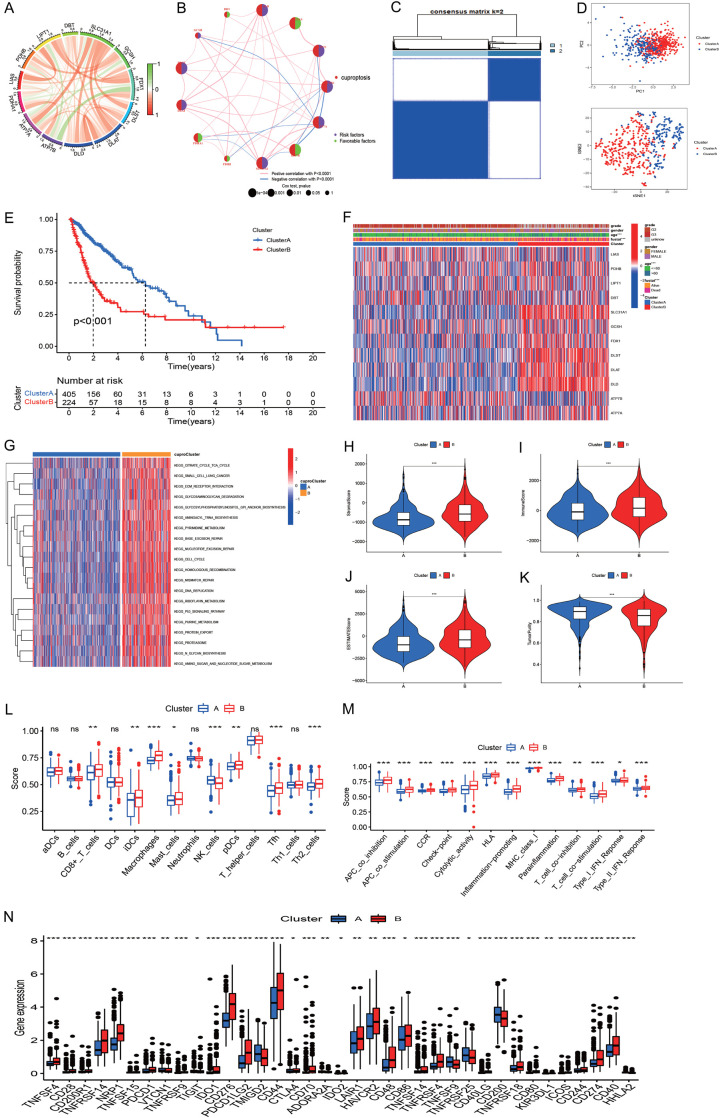
Figure 3.
Molecular clusters of gliomas based on cuproptosis genes. A: The correlations among 13 cuproptosis genes. B: Correlations of cuproptosis regulators with prognosis. C: The consensus matrix indicated the optimal number (k = 2) of clustering in TCGA. D: Principal component analysis showed clear and sharp distributions of two cuproptosis clusters. E: The Kaplan-Meier curve indicated that the two subtypes had different survival outcomes. F: Heatmap showed the correlations of cuproptosis cluster with clinical measures and cuproptosis regulator expression. G: Heatmap of GSVA identified differential pathways of the two cuproptosis clusters. H-K: Differences of stromal score, immune score, estimate score, and tumor purity of the two cuproptosis clusters. L, M: Immune cell infiltration levels of the two cuproptosis clusters. N: Expression of immune checkpoint genes of the two cuproptosis clusters.

