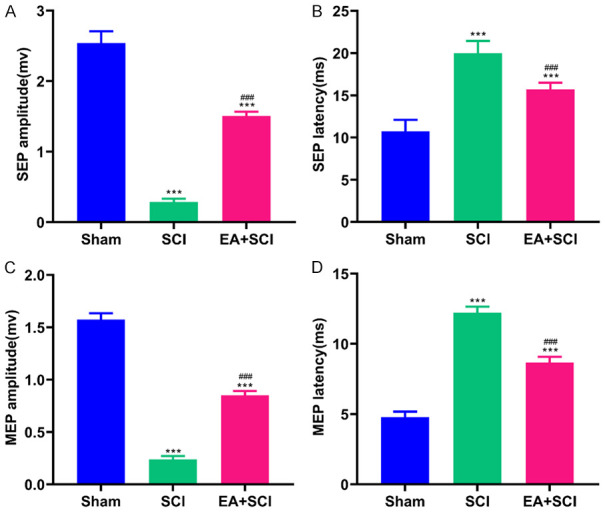
Figure 3.

EA contributed to electrophysiological recovery after SCI. The plots showed the amplitude (A) and latency (B) of SEPs. The plots showed the amplitude (C) and latency (D) of MEPs. ***P < 0.001 compared with Sham group; ###P < 0.001 compared with SCI group. Data are represented as mean ± SD, (n = 10).
