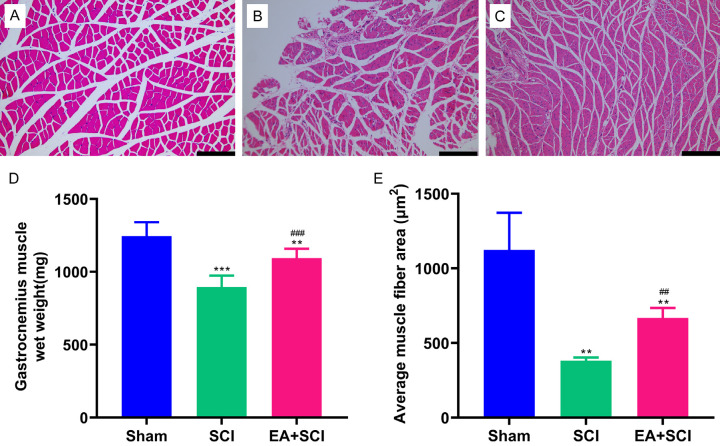
Figure 5.
EA treatment alleviated skeletal muscle atrophy following spinal cord injury. (A-C) Representative muscle fibers stained by hematoxylin and eosin are displayed in the Sham, SCI, and EA + SCI groups, respectively. (D) Wet weight of gastrocnemius muscle. (E) Quantification of cross-sectional area (μm2) of gastrocnemius muscle fibers. **P < 0.01, as compared with the Sham group; ##P < 0.01, as compared with the SCI group. Data are presented as mean ± SD. n = 6, Scale bars = 200 μm in (A-C).

