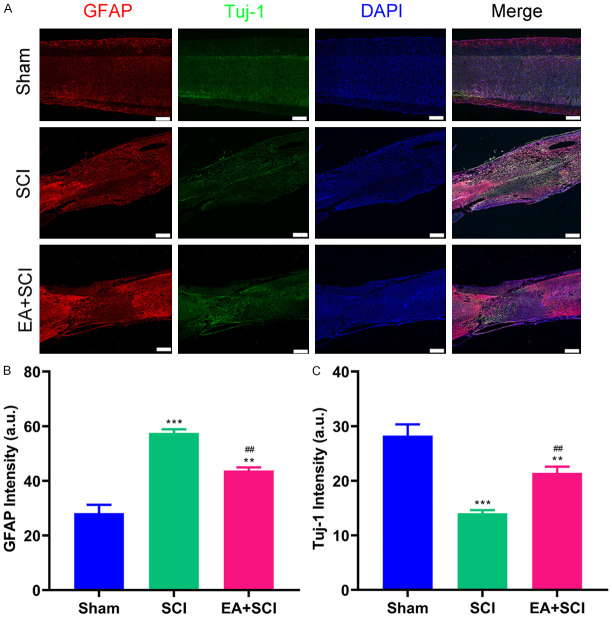
Figure 6.
Immunofluorescence staining of spinal cord tissue and evaluation. (A) Immunofluorescence of SCI staining with astrocytes marker GFAP and neuron marker Tuj-1. Intensity analysis of (B) astrocytes marker GFAP expression, (C) neuron marker Tuj-1 expression. **P < 0.01, ***P < 0.001 as compared with the Sham group; ##P < 0.01, as compared with the SCI group. Data are presented as mean ± SD. n = 6, Scale bars = 400 μm.

