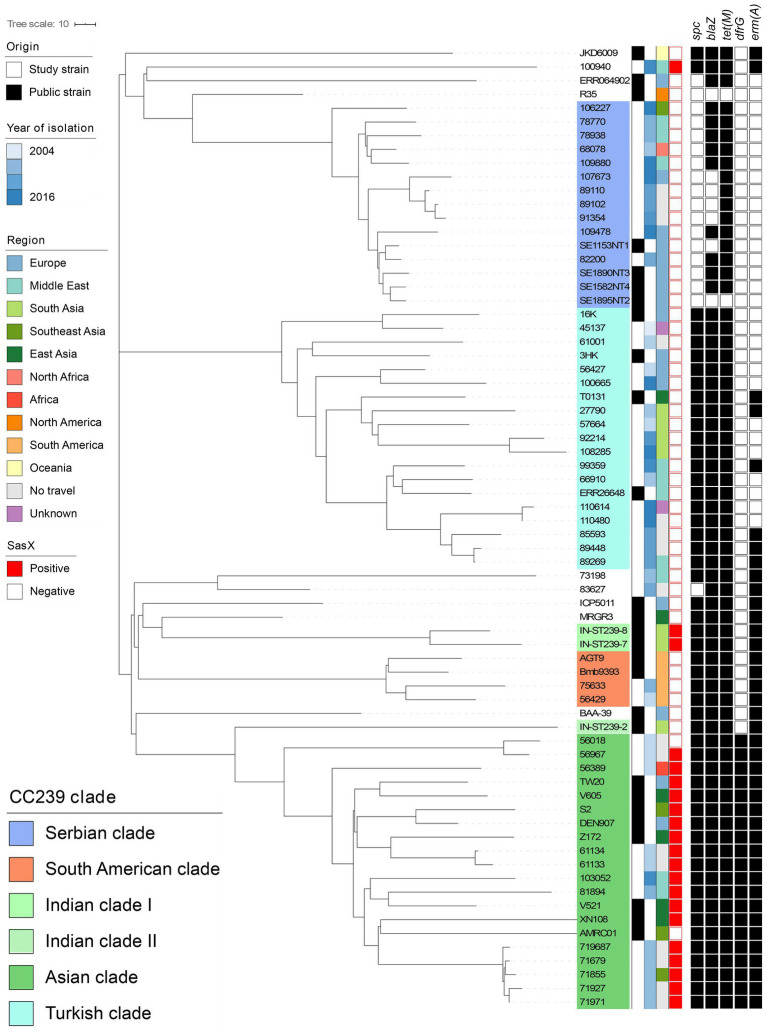
Figure 2.
Core-genome phylogeny of all MRSA ST239 isolates isolated from Denmark (n = 40) and published context sequences (n = 27). Clustering is done in line with Harris et al. (2010) and De Backer et al. (2019) clades are indicated by colored overlays. Metadata is visualized in the lanes in compliance to the legend, from left to right: (i) Origin of the isolate; (ii) Year of isolation; (iii) Region of travel; (iv) sasX carriage; and (v) Carriage of antimicrobial resistance genes spc, blaZ, tet(M), dfrG, and erm(A) with black signifying carriage and white non-carriage. The context sequences were downloaded from Genbank and Sanger Institute. Branch lengths represent the substitution rate per position in the core-genome alignment as indicated in the scale bar. The tree is publicly available on MicroReact (https://microreact.org/project/oxRfLg4vYw4KqeXRdUXb33).

