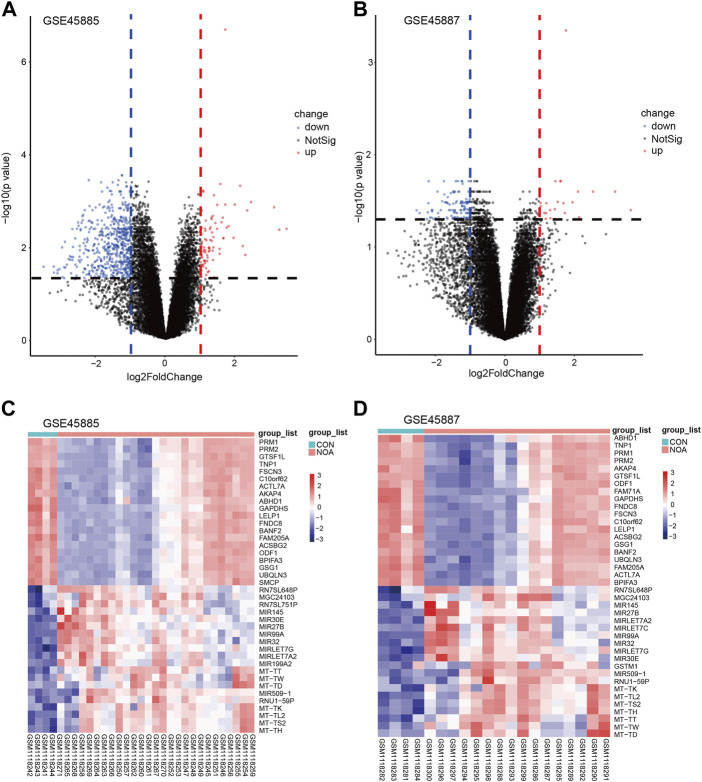
FIGURE 4.
Volcano plots and heatmap of DEGs. (A) Volcano plots of GSE45885, (B) volcano plots of GSE45887. The x-axis label represents log2FoldChange and the y-axis label represents–log10 (adjusted p-value). Data points in red represent upregulated, and green represent downregulated genes. No significantly changed genes are marked as gray points. Heatmap of the top 40 DEGs screened by limma package in R software. (C) Heatmap of GSE45885, (D) heatmap of GSE45887. Red areas represent highly expressed genes and blue areas represent lowly expressed genes in NOA. Darker color indicates the higher multiple of DEGs. DEGs: differentially expressed genes; NOA: non-obstructive azoospermia.

