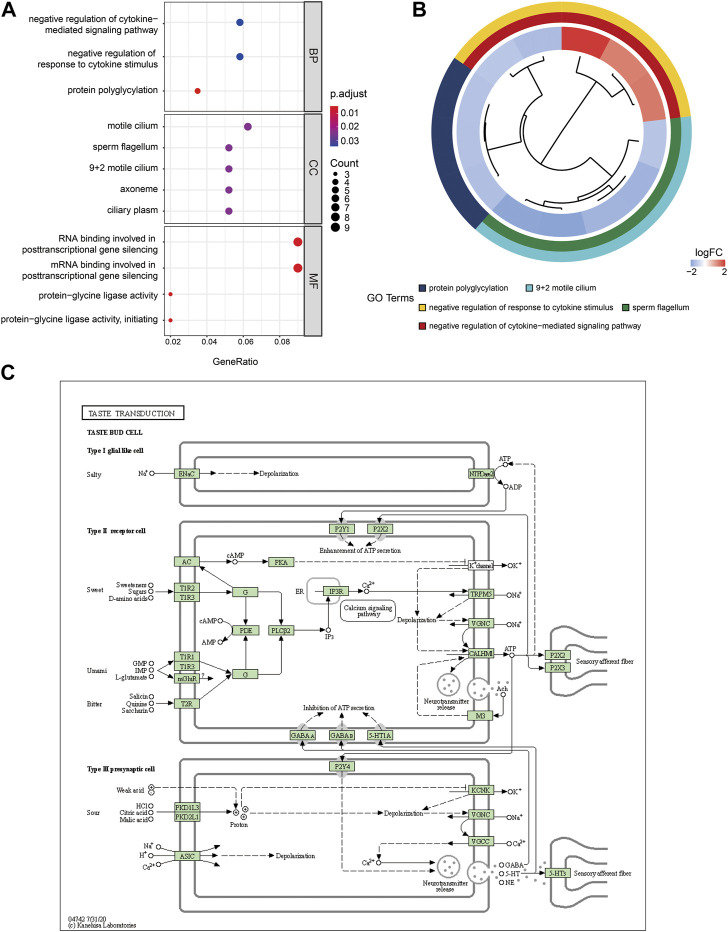
FIGURE 6.
GO enrichment and KEGG pathway analysis of DEGs. (A) GO enrichment result of DEGs. The x-axis label represents gene ratio and y-axis label represents GO terms. The color indicates GO terms, red indicates activated and blue indicates inhibited. The size of circle represents gene count. Different colors of circles represent different adjusted p values. (B) GOplot results combined with gene expression logFC. (C) The most significant enrichment signaling pathway was hSA04742: taste transduction. GO: Gene ontology; KEGG: Kyoto Encyclopedia of Genes and Genomes; MF: molecular function; BP: biological processes; CC: cell composition.

