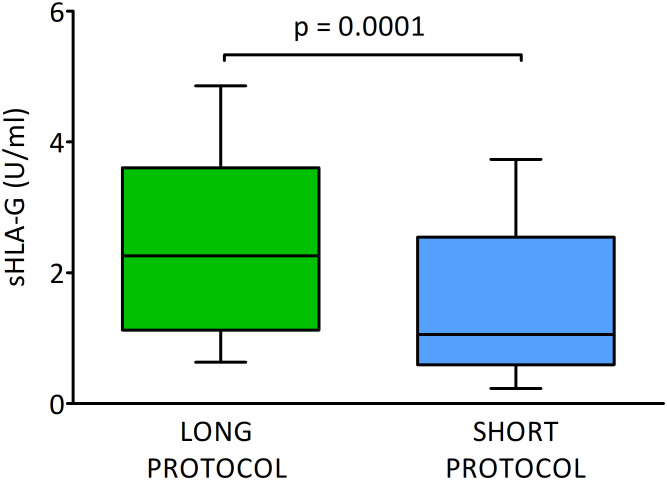
Figure 2.
Secretion of soluble HLA-G (U/ml) by embryos in different ovarian stimulation protocols. Green box represents the level of sHLA-G measured in embryo media in long cycle, blue box – in short cycle. Boxes are drawn from the first quartile (25th percentile) to the third quartile (75th percentile). Black lines in boxes are medians. Whiskers represent 10-90 percentiles. P-values are calculated by Mann-Whitney test.

