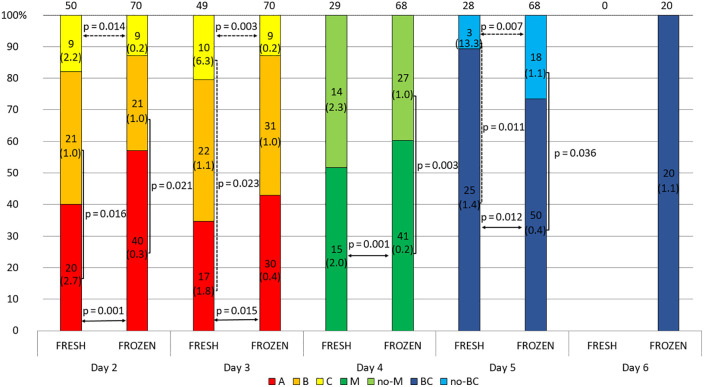
Figure 5.
Effect of embryo quality on the concentration of secreted HLA-G in the fresh and frozen cycle. 1) development of embryos over time from the second to the sixth day (height of the colored stripes); 2) secretion comparisons between fresh and frozen cycle groups (horizontal arrows); 3) comparisons of secretion between embryos of different classes or stages of development (vertical clamps). A, B, C – class of the embryo, M – embryo in the morula stage; no-M – embryo that has not reached the morula stage; BC – embryo in the blastocyst stage; no-BC – embryo that has not reached the blastocyst stage; Dashed line – p-value resulting from analyses with insufficient number of embryos. Median concentration of sHLA-G was presented in brackets. P-values are calculated by Mann-Whitney test or t-test.

