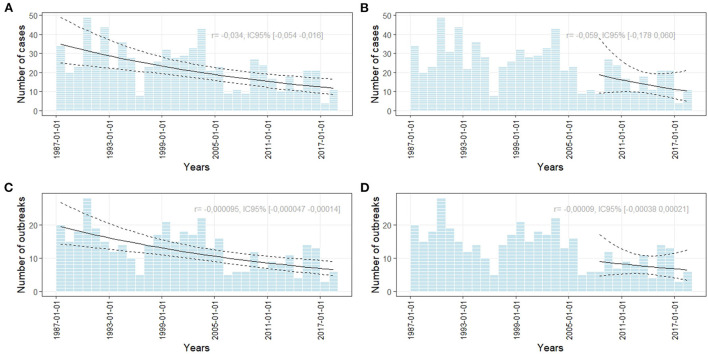
Figure 1.
Number of foodborne human botulism outbreaks and cases based on NRC data. The curves represent a trend analysis over the period 1987–2018 (A,C) and over the period 2008–2018 [panel (B,D)]. r represents the growth rate of the log-linear model used for assessing the growth or decline of the number of cases or oubreaks.

