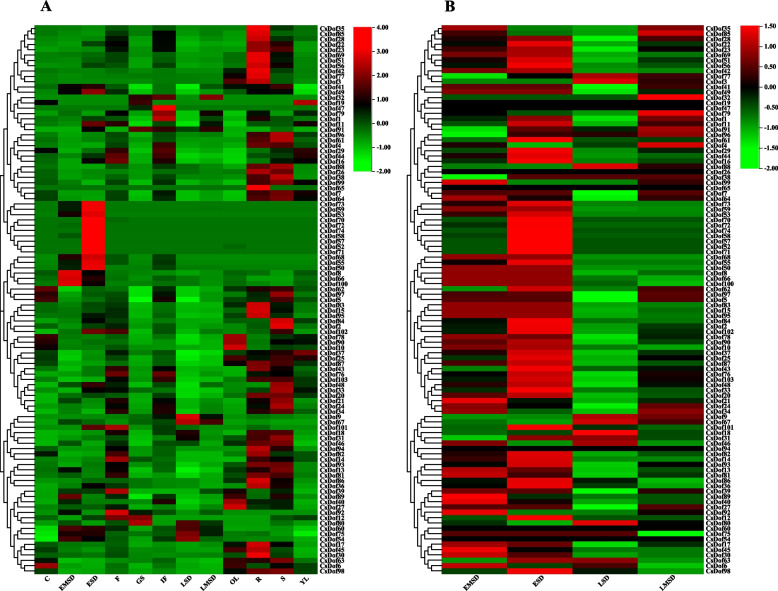
Fig. 6.
Heat map representation and hierarchical clustering of the CsDof gene expression profiles in twelve tissues. A Expression profile of CsDof genes in 12 tissues. B Expression profiles of CsDof genes in seeds at different developmental stages. The expression levels of CsDof genes were showed by different colors on the right scale. C, cotyledon; EMSD, early-mid seed development; ESD, early seed development; F, flower; GS, germinating seed; IF, inflorescence; LSD, late seed development; LMSD, late-mid seed development; OL, mature leaf; R, root; S, stem; YL, young leaf

