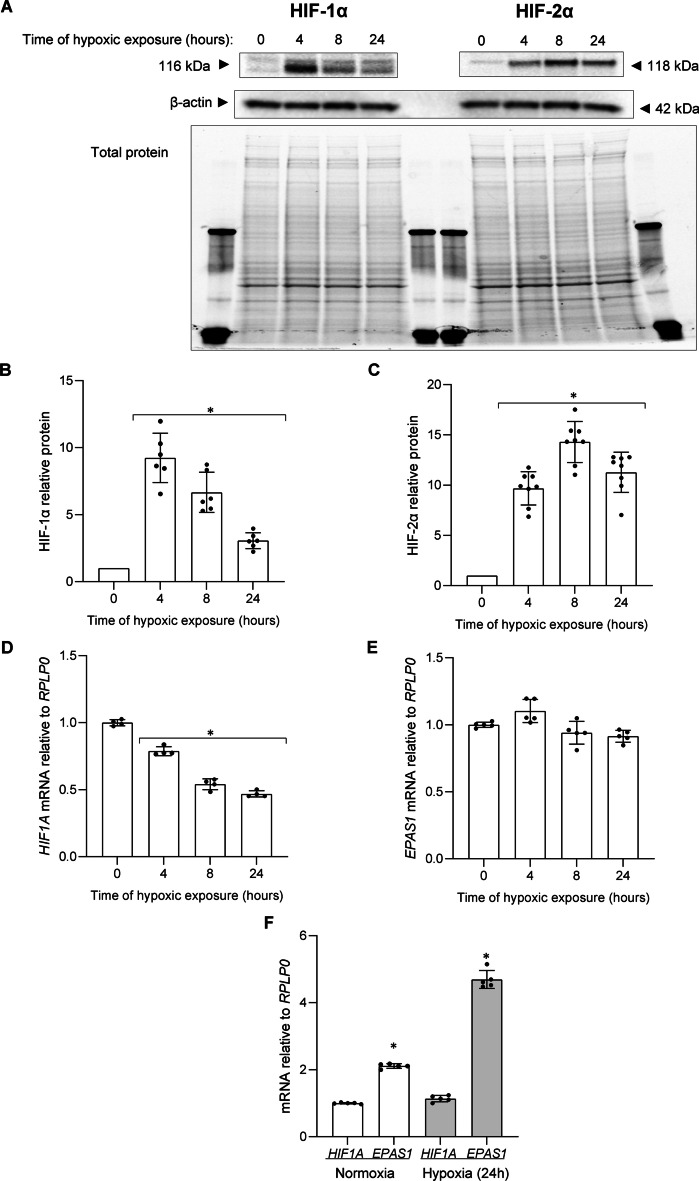
Fig. 1.
Hypoxia results in the accumulation of HIF-1α and HIF-2α in HUVECs. Cells were exposed to hypoxia for the time periods specified, and total RNA and protein lysates were collected. The changes in HIF-1α and HIF-2α protein levels were evaluated by western blot (A) normalized to β-actin and total protein levels and related to the normoxic control (B, C). Data represent the mean ± SD of at least four independent experiments. * P < 0.05 was considered significant. HIF1A and EPAS1 mRNA levels were quantified by qRT-PCR and normalized to RPLP0 mRNA levels, and expressed as a fold change over normoxic samples (D, E). Data represent the mean ± SD of at least four independent experiments (3 replicates each). * P < 0.05 was considered significant. The ratios between HIF1A and EPAS1 mRNAs in HUVECs cultured in normoxia and hypoxia, based on qRT-PCR quantification in the same samples, the HIF1A mRNA level was considered as one for both conditions (F). Data represent the mean ± SD of five independent experiments (3 replicates each). * P < 0.05 was considered significant

