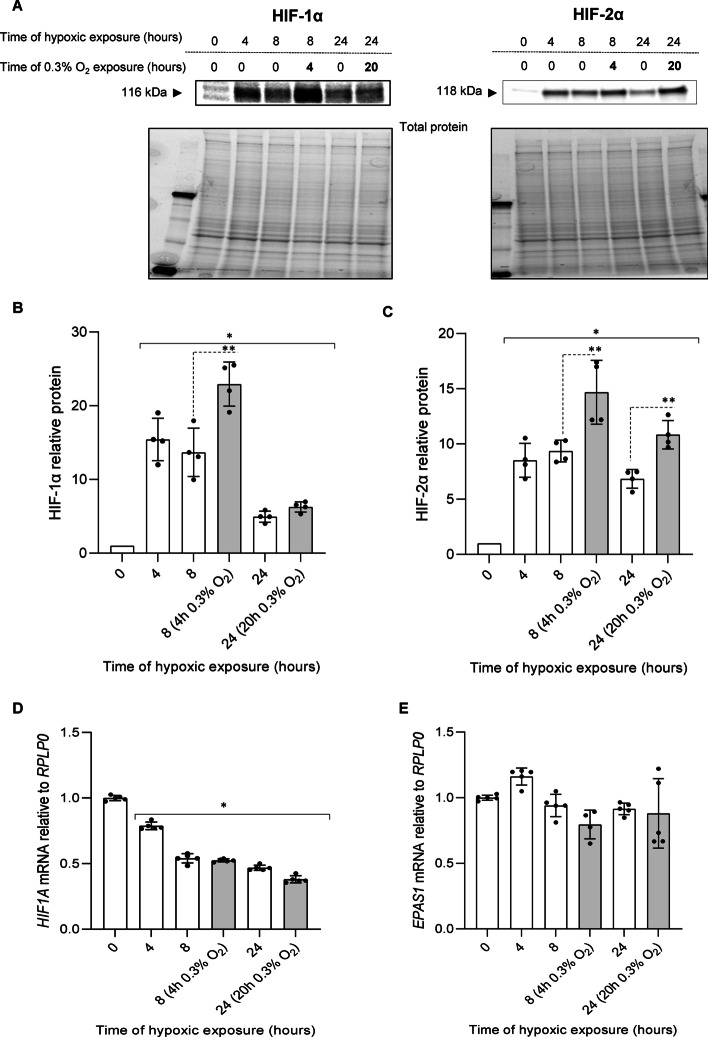
Fig. 6.
Inhibition of PHD activity during hypoxia by reducing oxygen levels results in accumulation of HIF-1α and HIF-2α in HUVECs. Cells were exposed to 1% O2 for 4 h, and next moved to 0.3% O2 (grey bars) or remained in the same conditions for the time periods specified, and total RNA and protein lysates were collected. The changes in HIF-1α and HIF-2α protein levels were evaluated by western blot (A) normalized to total protein levels and related to the normoxic control (B, C). Data represent the mean ± SD of four independent experiments. * P < 0.05 was considered significant. HIF1A and EPAS1 mRNA levels were quantified by qRT-PCR and normalized to RPLP0 mRNA levels and expressed as a fold change over normoxic samples (D, E). Data represent the mean ± SD of five independent experiments (3 replicates each). * P < 0.05 was considered significant

