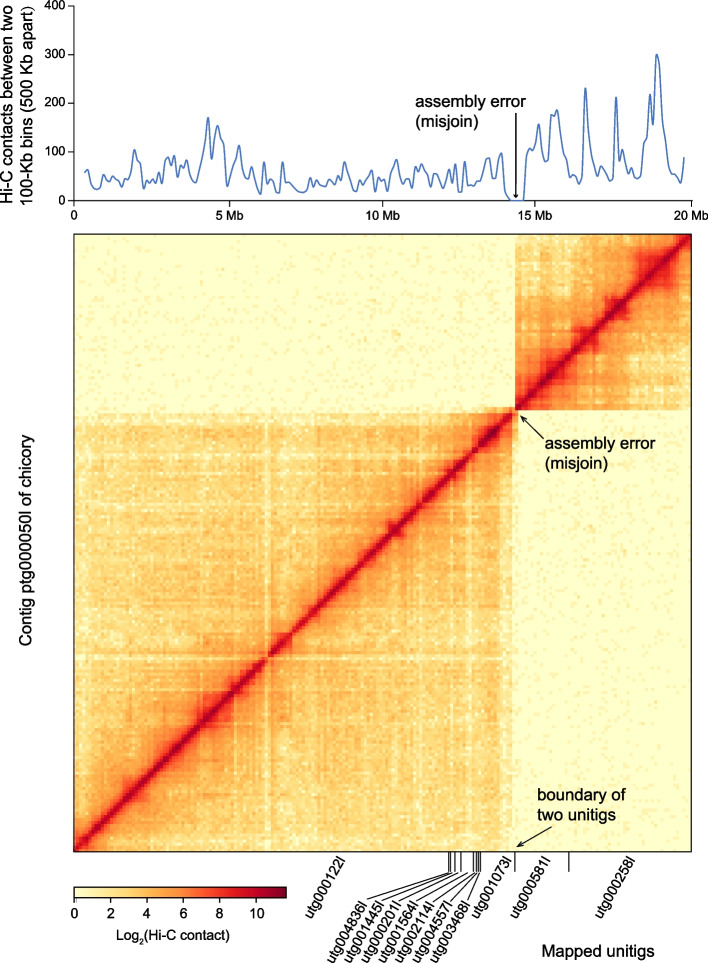
Fig. 2.
Example of assembly error detection in a contig from chicory. The upper part shows the change of Hi-C contact between two 100-Kb bins 500-Kb apart along the 20-Mb long contig “ptg000050l” from left to right. The lower part is the Hi-C contact heatmap of the contig “ptg000050l”, in which the size of each bin is 100-Kb and the color of each bin is proportional to the Hi-C contact value between two bins. The mapping relationship of unitigs to the contig “ptg000050l” were shown in the horizontal axis. The genomic site with sharp change of Hi-C contact pattern and also is the boundary of two neighbor unitigs, indicates an assembly error

